Planetary systems · UNIR
Martian weather data from REMS on board Curiosity (NASA)
How the eccentricity of the Martian orbit and the tilt of its axis shape the seasons, from the pressure recorded by REMS in Gale crater on sols 53, 196, 350 and 543, and the replacement of the latter with sol 1212.

Introduction
This study examines how the high eccentricity of the Martian orbit, combined with the roughly 25° tilt of its rotation axis, drastically affects the planet’s seasons. To do so, the pressure data recorded by the REMS weather station on board the Curiosity rover in Gale crater are analysed. These data show how pressure varies with the season studied: spring, summer, autumn and winter.
To interpret these records, the main characteristics of the Martian atmosphere, its climatology and its meteorology are first explored. Then, after processing the MODRDR files for sols 53, 196, 350 and 543, atmospheric pressure is plotted against local solar time to analyse what conclusions can be drawn from these observations. This work is the first part of a study that continues with the MEDA data from Perseverance.
1. The Martian atmosphere: climatology and meteorology
Although Mars is often thought of as similar to our planet, it could really be considered its “little brother”: its diameter is barely half that of the Earth, about 6780 km (NASA, 2024).
It is a rocky world that shares geological processes with the Earth, but with fundamental differences in its atmosphere. The pressure on Mars is about 140 times lower than on Earth, with a mean of barely 7 millibars at the surface. Its air is almost entirely carbon dioxide (CO₂), with small amounts of nitrogen (3 %) and argon (2 %) (Franz et al., 2017), while oxygen and water vapour are only trace gases.
This very thin atmosphere is the result of a violent past. Being a smaller planet, the core of Mars cooled quickly, which stopped its dynamo and caused it to lose its protective magnetic field (Jakosky, 2020). Without that shield, the solar wind swept much of its atmosphere into space, a process that continues today.
Mars also shows a huge contrast between its two halves: the northern hemisphere is lower and smoother (an ancient ocean may have existed there), while the southern hemisphere is much higher, older and full of craters. This difference in height influences the circulation of the air on the planet.
In addition, the orbit of Mars is not a perfect circle but highly eccentric (Figure 1), so the distance between the planet and the Sun changes drastically (between about 206 and 249 million kilometres, that is, from 1.38 AU at perihelion to 1.67 AU at aphelion).
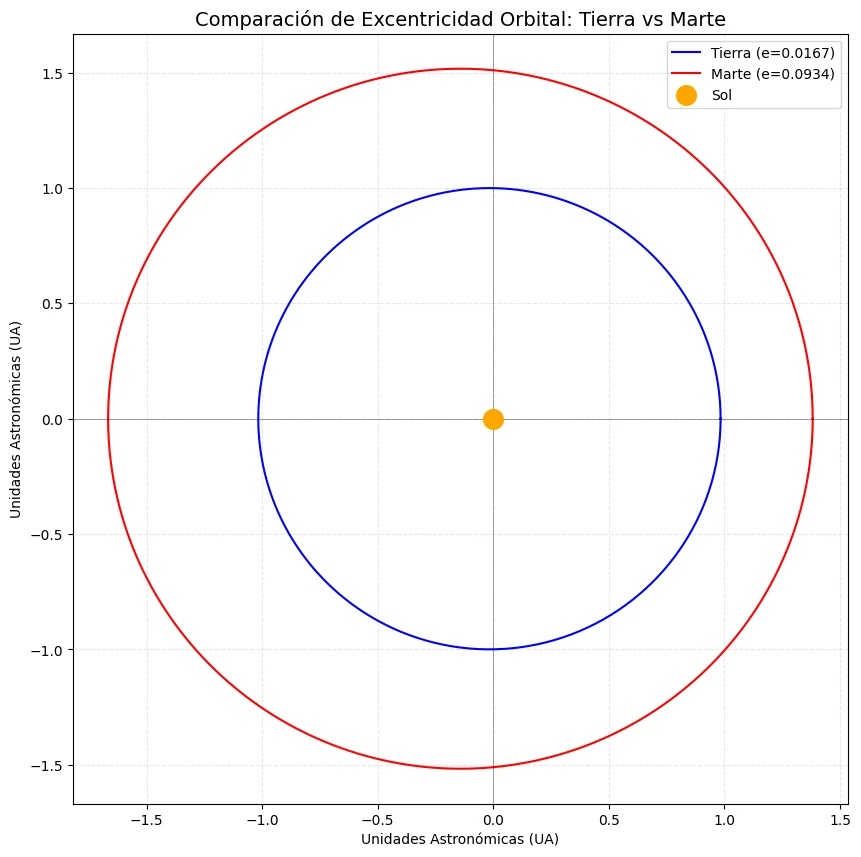
This, added to the 25° tilt of its axis, makes the seasons much more extreme than on Earth. For example, the southern-hemisphere summer is hotter but shorter, because it coincides with the time when the planet is closest to the Sun and moves fastest in its orbit.
Mars is a very cold planet because its atmosphere is so thin that it does not retain heat efficiently. Even so, it has clouds of water ice and of CO₂, as well as the well-known dust devils, which inject dust into the atmosphere.
On Mars, dust plays a role similar to that of water vapour on Earth: it can completely change the temperature of the planet, blocking sunlight during the day or acting as a blanket that retains heat at night. There are even global dust storms that can envelop the whole planet for months.
2. Methodology and data processing
This analysis used the information collected by the REMS weather station installed on the Curiosity rover. Curiosity landed in August 2012 in Gale crater, an area close to the Martian equator. The station has sensors that measure variables such as pressure, temperature and wind on every sol (the Martian day, which lasts 24 hours and 39 minutes).
To ensure the greatest accuracy, the highest-level data, called MODRDR, were used. These files are the most reliable because they have already been calibrated and corrected with NASA scientific models (PDS Atmospheres Node, 2024). Specifically, four key moments were selected to observe the seasonal changes in the southern hemisphere:
- Sol 53: spring equinox.
- Sol 196: summer solstice.
- Sol 350: autumn equinox.
- Sol 543: winter solstice.
NASA’s raw data are distributed in files with the extension .TAB, very long text tables that are hard to read by eye. They were processed with Python in a Google Colab environment. The source code and the processed data files are available in the public GitHub repository given at the end. The cleaning process consisted of the following steps:
- Variable extraction. From the many columns in the file, column 2 (local mean solar time, LMST) and column 38 (atmospheric pressure) were selected.
- Error filtering. All rows with
UNK(unknown) orNULLvalues were removed; these usually appear when a sensor suffers a momentary failure or no reading is available. - Time adjustment. REMS files use a complex time format (for example,
00053M00:00:00). A function was written to clean these codes and keep only hours, minutes and seconds, so that they could be plotted easily.
An important detail of REMS is that it normally measures only during the first 5 minutes of every hour to save energy, although it sometimes makes “extended observations” lasting a full hour. To make the plot clearer and avoid noise, all the data were grouped into 5-minute bins and the mean pressure of each bin was calculated. This makes it possible to distinguish two elements in the final plot:
- Individual points: the standard measurements at the start of each hour.
- Continuous lines: the periods in which the rover measured continuously for a whole hour.
In this first stage, the data for the four sols mentioned were plotted. Figure 2 shows the behaviour of atmospheric pressure in Gale crater during the four seasons of a standard Martian year:
- Daily variation (thermal tides). In all the curves, pressure is not a flat line: it rises and falls every 24 hours. This happens because the atmosphere of Mars is very light and responds quickly to the heat of the Sun (Pla-García et al., 2016). As the air warms during the day, a pressure wave is generated that travels around the planet, which explains the daily peaks and troughs.
- Seasonal difference. The most striking feature is that the curves lie at different heights. Pressure is much higher in summer (sol 196) than in spring (sol 53). This is because on Mars the air itself freezes at the poles during winter, forming caps of dry ice (CO₂). When summer arrives, that ice turns back into gas (sublimation) and returns to the atmosphere, raising the global pressure.
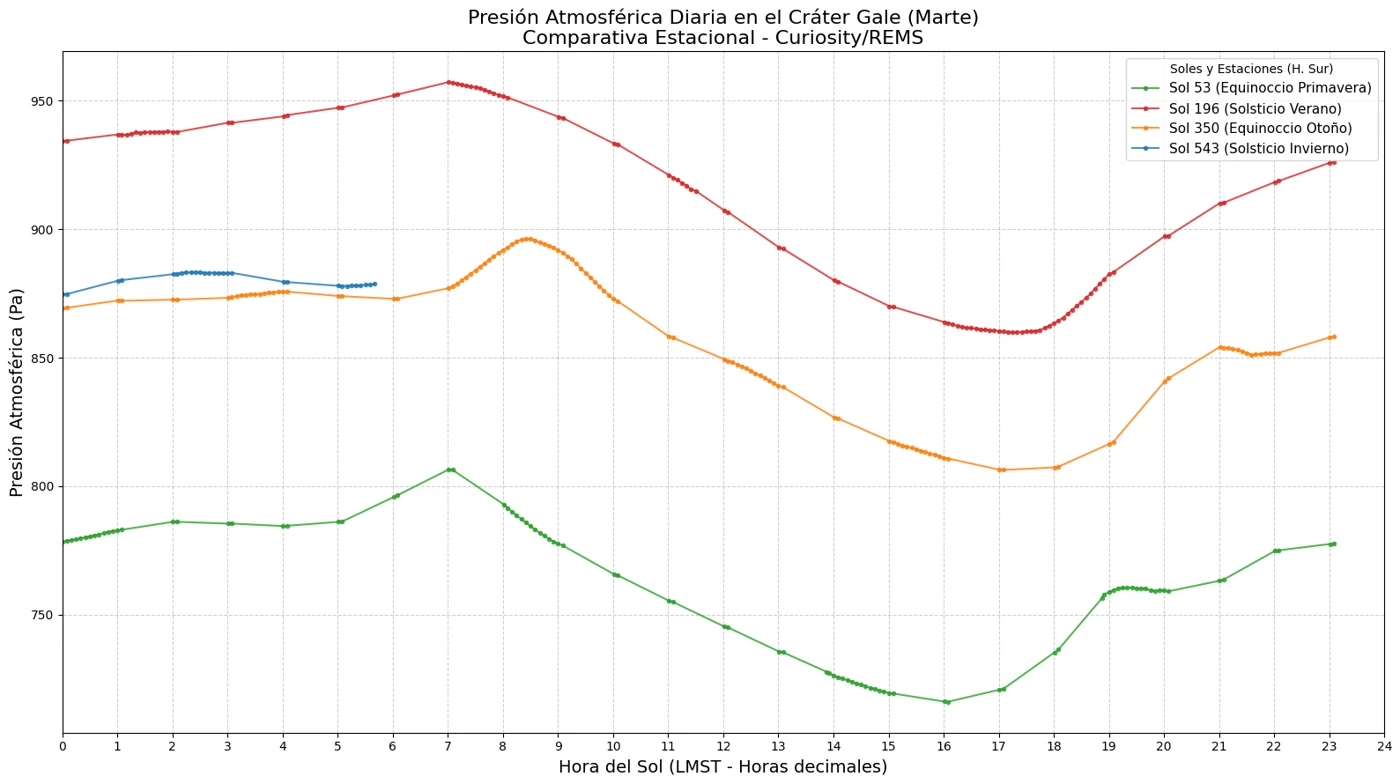
Observed limitation. A closer look at the curve for sol 543 (winter) shows that there are data only for the first 6 hours of the day. This prevents the full winter cycle from being seen and its daily amplitude from being compared with that of the other seasons.
Looking for a complete cycle: sol 1212. To make up for the missing data at the winter solstice, an equivalent sol was sought in a later Martian year. Since a year on Mars lasts about 668 sols, seasonal events repeat on that cycle. Adding the length of a Martian year to sol 543 (543 + 668 = 1211) and checking the NASA repository, sol 1212 was found to correspond exactly to the same seasonal moment (winter solstice), with a much more complete record of the 24 hours of the day.
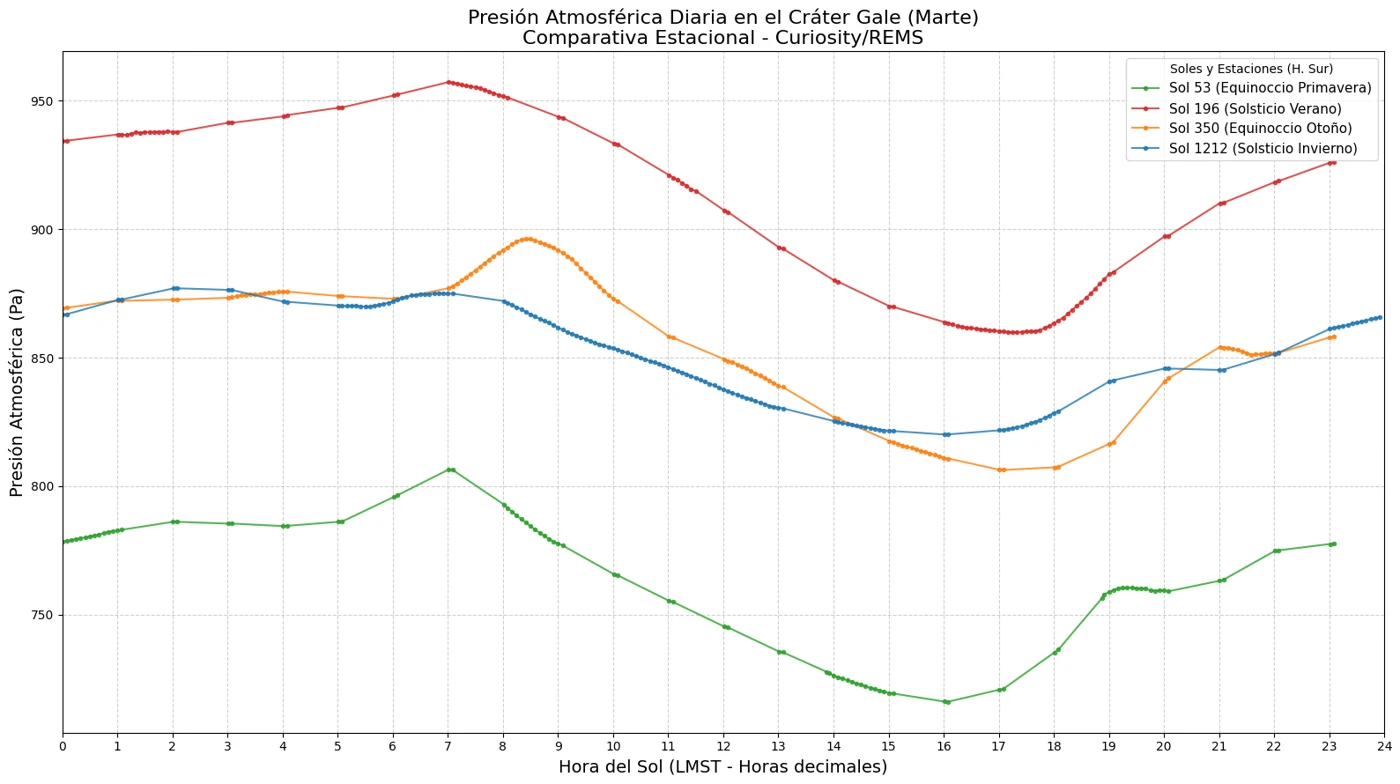
With sol 1212 included, a much clearer view of the meteorology of Gale emerges:
- Maximum in summer. The summer curve (red) is the highest because the southern summer coincides with the time when Mars is closest to the Sun (perihelion). The south pole warms strongly and releases a huge amount of gas into the atmosphere, which increases the atmospheric pressure.
- Spring is the lowest point. The green curve (sol 53) lies at the bottom because the poles have accumulated the largest amount of ice, “stealing” gas from the atmosphere, so the global atmospheric pressure is at its minimum.
- Stabilisation in winter and autumn. Thanks to sol 1212, it can be seen that pressure in winter is moderate. This happens because, while one pole freezes, the other releases gas, which creates a temporary balance in the pressure that Curiosity measures near the equator.
Conclusions
Despite being much thinner than the Earth’s (with a mean pressure of barely 7 millibars), the atmosphere of Mars is extremely dynamic and sensitive, and it responds immediately to changes in temperature. The daily variations seen in all the plots demonstrate the existence of thermal tides: pressure waves that travel around the planet every sol because of how quickly its light carbon-dioxide atmosphere heats up and cools down.
The high eccentricity of the Martian orbit is responsible for the seasons not being symmetric. As observed, the southern-hemisphere summer (sol 196) shows the highest pressure levels. This happens because, with the planet at its closest point to the Sun (perihelion), the heat is enough for the dry ice of the polar caps to turn massively into gas and increase the total mass of the atmosphere.
The study of these data also invites reflection on the fragility of the Martian climate. It is now known that Mars loses tonnes of gas to space every day through the action of the solar wind, a process that began millions of years ago, when the planet lost its protective magnetic field. What Curiosity measures is the remnant of an atmosphere that was once much denser and allowed liquid water to exist on the surface.
Finally, replacing sol 543 with sol 1212 underlines a fundamental lesson of scientific research: data are not always perfect or complete. Identifying a gap in the information and finding a technical solution, such as calculating an equivalent sol in a later Martian year, was key to obtaining an uninterrupted view of the winter in Gale and a much more solid seasonal comparison.
Data and code availability
All the data used in this study were obtained from NASA’s Planetary Data System (PDS). The Python code used for cleaning, averaging and plotting the atmospheric pressure is available at github.com/maildovale/Analisis-Atmosfera-Marte-REMS.
Tools: Python 3, Pandas and Matplotlib.
References
- Franz, H. B., Trainer, M. G., Malespin, C. A., Mahaffy, P. R., Atreya, S. K., Manning, H. L., & Wong, M. H. (2017). Initial SAM calibration gas experiments on Mars: Quadrupole mass spectrometer results and implications. Planetary and Space Science, 138, 44–54.
- Jakosky, B. M. (2020). Atmospheric loss to space and the history of water on Mars. Annual Review of Earth and Planetary Sciences, 48(1), 711–738.
- NASA (2024). Mars: Facts. NASA Science.
- PDS Atmospheres Node (2024). Mars Science Laboratory: REMS MODRDR Data Product Documentation. NASA Planetary Data System.
- Pla-García, J., Rafkin, S. C. R., Martínez, G. M., Vicente-Retortillo, Á., Newman, C. E., De la Torre Juárez, M., & Savijärvi, H. (2016). The meteorology of Gale crater as determined from rover environmental monitoring station observations and numerical modeling. Part I: Comparison of model simulations with observations. Icarus, 280, 103–113.