Planetary systems · UNIR
Martian weather data from MEDA on board Perseverance (NASA)
Daily and seasonal variation of atmospheric pressure in Jezero crater measured by MEDA, and its comparison with REMS in Gale crater to separate global phenomena from local effects.

Introduction
Mars is a planet with an extremely thin but very dynamic atmosphere. Although its mean pressure is about 140 times lower than the Earth’s, meteorological records show very marked variations associated with the seasons, the eccentricity of its orbit and the tilt of its rotation axis.
In a previous analysis, these behaviours were assessed from the pressure data recorded by the REMS instrument on board the Curiosity rover in Gale crater. Here the study is extended with data from the MEDA instrument (Mars Environmental Dynamics Analyzer), installed on the Perseverance rover, which operates in a different region of the planet: Jezero crater, in the Martian northern hemisphere (Figure 1).

The aim is to study the daily and seasonal variation of atmospheric pressure in Jezero and compare it with the results obtained in Gale, in order to identify the global phenomena and the local effects associated with each region.
Data source and location of the missions
The data come from NASA’s Planetary Data System (PDS). Specifically, the highest-level processed products of the MEDA instrument (DER, Derived Data) were used, already calibrated and corrected with scientific models (PDS Atmospheres Node, 2024).
MEDA is part of the Perseverance rover, which landed in February 2021 in Jezero crater (4.5° N, 135.6° E), an ancient lake basin of great astrobiological interest. The Curiosity rover, for its part, has been operating since 2012 in Gale crater (4.59° S, 137.44° E), close to the Martian equator and at a significantly lower elevation than Jezero.
The analysis was carried out on four sols representative of the seasons of the Martian northern hemisphere: sol 182 (summer), sol 361 (autumn), sol 504 (winter) and sol 658 (spring). They make it possible to characterise the seasonal evolution of atmospheric pressure and allow a direct comparison with the results previously obtained with REMS.
Methodology and data processing
Processing was carried out in Python, in a reproducible notebook-based environment. From each MEDA DER file, the columns corresponding to local mean solar time (LMST) and surface atmospheric pressure were extracted.
Since MEDA does not measure continuously throughout the sol, but in alternating hourly blocks to optimise power consumption, the observations had to be homogenised in time. To do this, LMST was converted to decimal format (0–24 h) and the data were grouped into 5-minute windows (≈ 0.083 h). The mean pressure was calculated in each window, and NaN values were assigned where no measurements were available.
Results of the MEDA analysis
The surface pressure data measured by MEDA in Jezero crater show a systematic diurnal variation in all the seasons analysed. In three of the four sols, maximum pressures are found in the early morning (LMST ≈ 7–8 h); in sol 504 (winter), the maximum is recorded at night (LMST ≈ 21.8 h). The minima generally appear during the afternoon (LMST ≈ 16–18 h), except in sol 182, whose minimum falls in the early hours (LMST ≈ 3 h).
Figure 2 shows the diurnal variation of surface pressure, averaged every 5 minutes, for the four sols analysed.
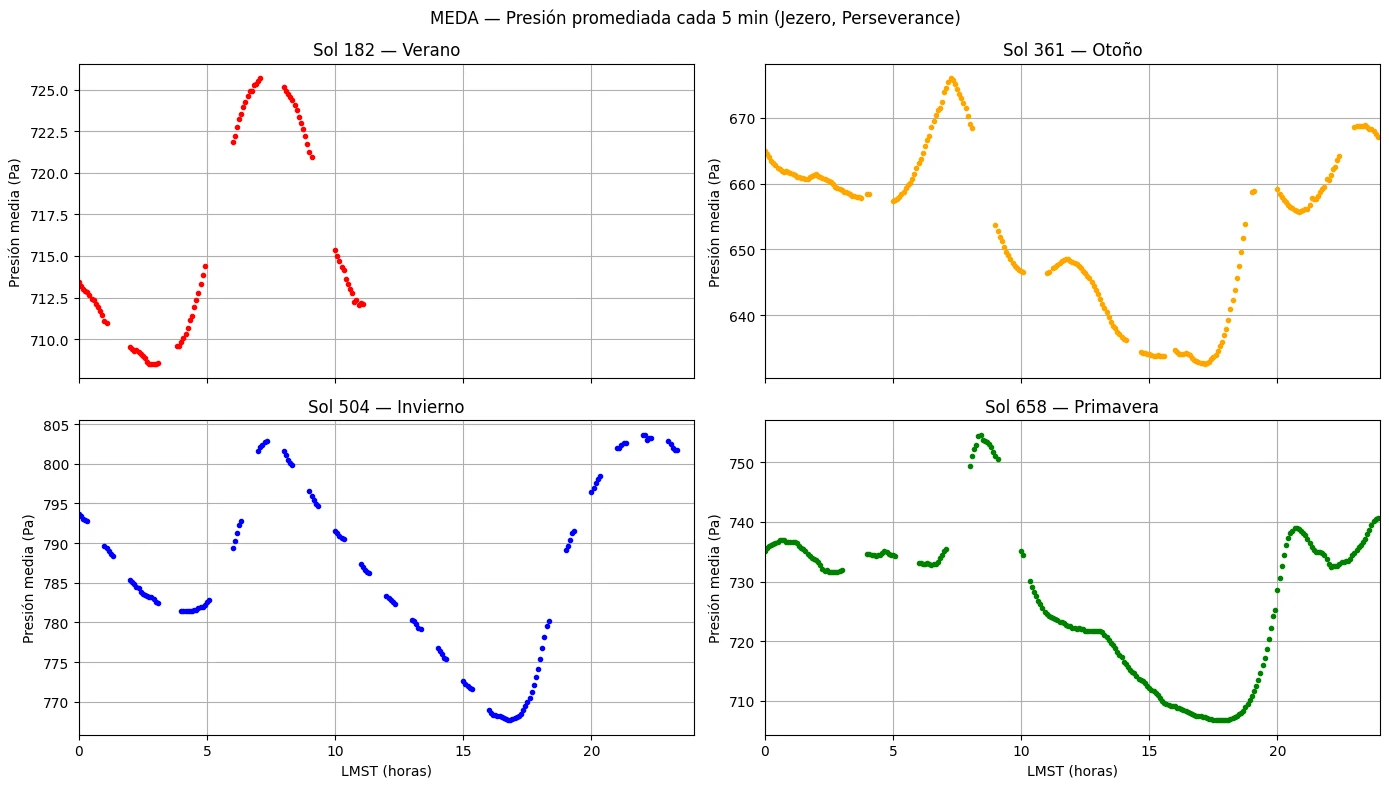
The amplitude of the daily oscillation varies between seasons, reflecting the seasonal changes in the total atmospheric mass. As a quantitative summary, Table 1 lists characteristic values of surface pressure: the daily mean pressure, the maximum and minimum values and the associated diurnal amplitude.
| Sol | Season | Mean pressure (Pa) | Pmax (Pa) | Time of max (h) | Pmin (Pa) | Time of min (h) | Max–min amplitude (Pa) |
|---|---|---|---|---|---|---|---|
| 182 | Summer | 715.69 | 725.53 | 7.29 | 708.51 | 3.04 | 17.02 |
| 361 | Autumn | 653.55 | 676.03 | 7.96 | 632.60 | 17.88 | 43.43 |
| 504 | Winter | 785.53 | 803.68 | 21.79 | 767.65 | 16.63 | 36.02 |
| 658 | Spring | 726.65 | 754.67 | 7.71 | 706.71 | 17.21 | 47.96 |
Table 1. Characteristic parameters of surface atmospheric pressure (MEDA).
Comparison between MEDA (Jezero) and REMS (Gale)
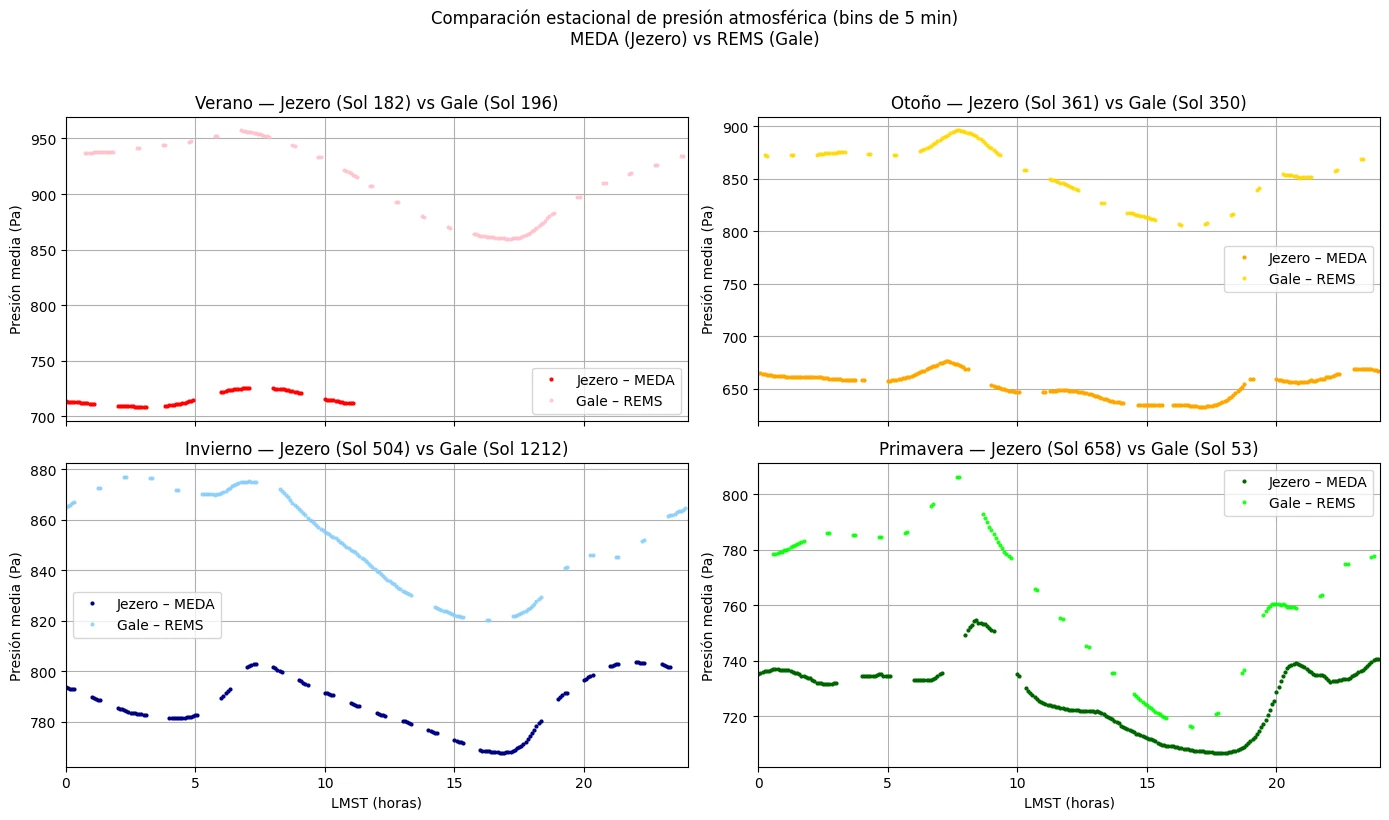
The patterns observed in the MEDA data are fully consistent with the results previously obtained from the REMS measurements in Gale crater. In both cases, a well-defined diurnal pressure oscillation is found, with night-time or morning maxima and afternoon minima, regardless of the season.
Figure 3 presents a direct comparison of the daily mean pressure measured by MEDA in the four seasons, which makes it possible to identify seasonal similarities and differences and facilitates the comparison with the REMS results.
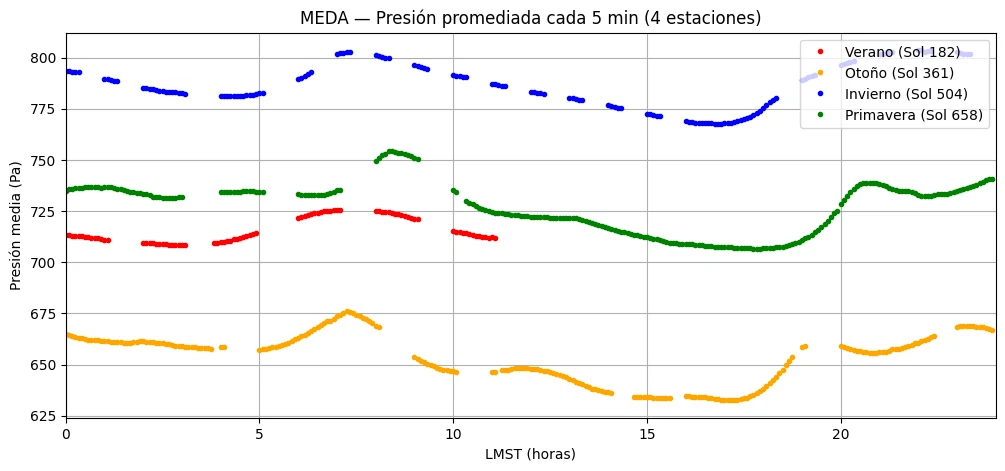
Both the MEDA and the REMS data show clear seasonal differences in the mean level of surface pressure. For REMS, the highest mean values were recorded during the Martian summer and the lowest in spring, with autumn and winter in intermediate positions. The MEDA data show an analogous seasonal hierarchy if the seasons are compared by solar longitude rather than by their name in each hemisphere: Jezero is in the northern hemisphere, so its winter (maximum, 785.5 Pa) coincides with the southern summer at Gale and its autumn (minimum, 653.6 Pa) with the southern spring. The absolute values are different, which is to be expected given the differences in latitude, altitude and geographical location between Gale and Jezero craters (Gómez-Elvira et al., 2012).
The agreement in the phase of the diurnal variation and in the seasonal structure of the pressure measured by both instruments, despite their instrumental and regional differences, makes it possible to infer that the dominant processes controlling surface pressure on Mars are global in nature. In particular, the daily thermal tide, associated with the periodic solar heating of the atmosphere, produces regular pressure oscillations that appear consistently in different regions of the planet (Forget et al., 1999; Martínez et al., 2017).
In addition, the systematic differences in the mean pressure level between seasons reflect the seasonal carbon-dioxide cycle: during winter, part of the atmospheric CO₂ condenses onto the polar caps and lowers the surface pressure, while in summer its sublimation increases the global atmospheric pressure (Hess et al., 1977; Forget et al., 1999).
Figure 4 presents a direct seasonal comparison between Jezero and Gale, overlaying the diurnal pressure variations for equivalent seasons in both hemispheres. This representation makes it possible to clearly identify both the global similarities and the regional differences between the two locations.
Conclusion
The seasonal comparison of the surface pressure measured by MEDA in Jezero crater and by REMS in Gale crater reveals Martian atmospheric dynamics dominated by the superposition of global and local processes. In all the seasons analysed, a well-defined diurnal oscillation is observed, with pressure maxima during the night or early morning and minima during the afternoon, which confirms the dominant role of the diurnal thermal tide driven by solar forcing.
On a seasonal scale, the differences in the mean pressure level reflect the impact of the high orbital eccentricity of Mars (≈ 0.093) and the tilt of its rotation axis (~25°). During the southern-hemisphere summer, the sublimation of the CO₂ stored in the polar caps increases the total atmospheric mass and raises surface pressure planet-wide; in winter the reverse occurs, with CO₂ deposition and a reduction of the global pressure. These effects are seen consistently both in Jezero and in Gale.
The absolute pressure differences between the two locations are explained mainly by regional effects. Gale crater lies at a significantly lower altitude than Jezero, which leads to systematically higher pressures because of the greater weight of the atmospheric column. In addition, local topography and regional thermal contrasts influence the amplitude of the diurnal oscillations.
Overall, the results show that surface pressure on Mars is controlled by robust, well-defined physical mechanisms: global processes determine the seasonal evolution of the mean pressure level, while local effects modulate the absolute values measured in each region. The consistency between MEDA and REMS strengthens the integrated understanding of the present Martian climate and demonstrates the scientific value of combining meteorological observations from different missions and locations on the planet.
Data and code availability
All the data used in this study were obtained from NASA’s Planetary Data System (PDS). The Python code used for cleaning, averaging and plotting the atmospheric pressure is available at github.com/maildovale/Analisis-Atmosfera-Marte-MEDA.
Tools: Python 3, Pandas and Matplotlib.
References
- Forget, F., et al. (1999). Improved general circulation models of the Martian atmosphere from the surface to above 80 km. Journal of Geophysical Research, 104(E10), 24155–24176.
- Gómez-Elvira, J., et al. (2012). REMS: The Rover Environmental Monitoring Station for Mars Science Laboratory. Space Science Reviews, 170, 583–640.
- Hess, S. L., Ryan, J. A., Tillman, J. E., Henry, R. M., & Leovy, C. B. (1977). The annual cycle of pressure on Mars measured by Viking landers 1 and 2. Geophysical Research Letters, 4(4), 141–144.
- Martínez, G. M., et al. (2017). The modern near-surface Martian climate: A review of in-situ meteorological data from Viking to Curiosity. Space Science Reviews, 212, 295–338.
- NASA (2024). Map of NASA’s Mars landing sites. NASA Science.
- PDS Atmospheres Node (2024). Mars 2020 MEDA Derived Data Product Documentation. NASA Planetary Data System.