Galaxies & cosmology · UNIR
Galactic parameters: from M100 to NGC 7331 with the Virtual Observatory
Characterisation of M100 in the optical, infrared and X-rays; isophote analysis of a spiral (M81) and a barred spiral (NGC 1365) with their distances and luminosities; ellipticity and equivalent radius of M60; and the distance to NGC 7331 with the Tully–Fisher relation.

1. Characterisation of the galaxy M100 in different spectral bands
M100 (NGC 4321) is a spiral galaxy in the Virgo cluster, classified as SAB(s)bc and located at a distance of about 50–60 million light years. It has a well-defined spiral structure, typical of grand-design galaxies, and a size comparable to that of the Milky Way. It is a galaxy with active star formation, with an inner ring associated with a central bar and a nucleus that hosts a supermassive black hole.
To characterise M100, observations at different wavelengths were used, with the aim of analysing its morphology and the physical origin of the emission detected in each band. All the data were obtained with the Aladin software, accessing several publicly available astronomical surveys.
1.1. Observation in the optical (blue band)
First, an image of M100 in the optical blue band was downloaded from the DSS2 Blue survey (Second Digitized Sky Survey), which provides optical images with enough resolution to study the morphological structure of nearby galaxies.
The spiral arms of M100 are clearly visible in this image, with bright regions distributed along its structure. These luminous areas indicate star-forming regions, dominated by young, massive, hot stars that emit strongly at short wavelengths, in the range of about 385–540 nm of the IIIa-J plate, corresponding to blue, which makes the spiral shape of the galaxy easy to identify.
1.2. Observation in the infrared
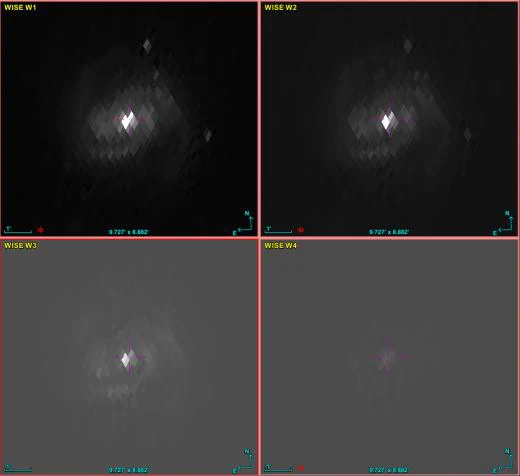
To study the infrared emission of M100, images from the WISE survey (Wide-field Infrared Survey Explorer) were used and the bands W1 (3.4 μm), W2 (4.6 μm), W3 (12 μm) and W4 (22 μm) were analysed. As Figure 1 shows, the W1 band is more sensitive to the emission of the old stellar population, which allows it to be correlated later with the blue band. This band also traces the stellar mass distribution of the galaxy and suffers less contamination from warm dust than the W3 and W4 bands, so it was considered the most suitable for this analysis.
1.3. Observation in X-rays
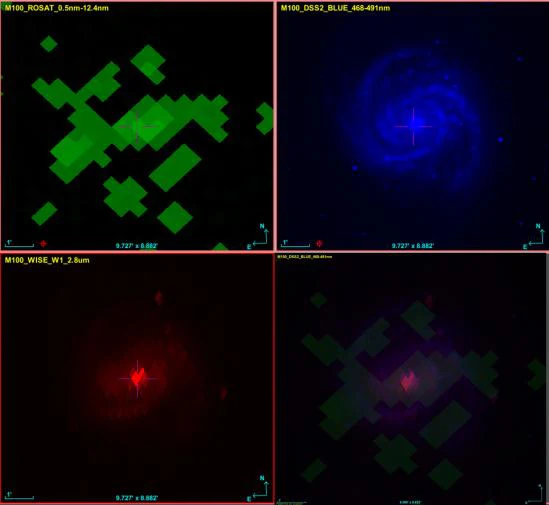
Finally, with data from the ROSAT All-Sky Survey (RASS), the X-ray emission was observed, at wavelengths from 0.5 to 12.4 nm. Although this survey has very limited resolution, structures can be seen that may be associated with point sources, such as X-ray binaries, supernova remnants or a possible weakly active nucleus. In general, these bands show high-energy processes, different from those that dominate the optical or infrared emission.
To better understand what was observed, the three previous bands were combined into a pseudo-colour composite with the Pixel Mapping tool (Figure 2), which gives general qualitative information. It shows together the regions with high-energy processes in greenish tones (ROSAT, X-rays), the spiral arms with young stars in blue (DSS2 Blue) and the old stellar population, which traces the stellar mass, in red (WISE W1).
2. A spiral and a barred spiral: isophotes, redshift, magnitude, distance and luminosity
Spiral galaxies are characterised by a disc with well-defined spiral arms that emerge from a central region or bulge, where much of the stellar mass is concentrated. In barred spiral galaxies, besides the disc and the arms, there is an elongated bar-shaped structure that crosses the nucleus and from whose ends the spiral arms emerge (Sparke and Gallagher, 2007; Conselice, 2014).
Isophote analysis makes it possible to identify these morphological differences, since the presence of a bar shows up as systematic variations in the ellipticity and position angle of the inner isophotes. Next, the spiral galaxy M81 and the barred spiral galaxy NGC 1365 are analysed to compare their morphological and physical properties, using an isophote analysis that reveals the presence or absence of a bar.
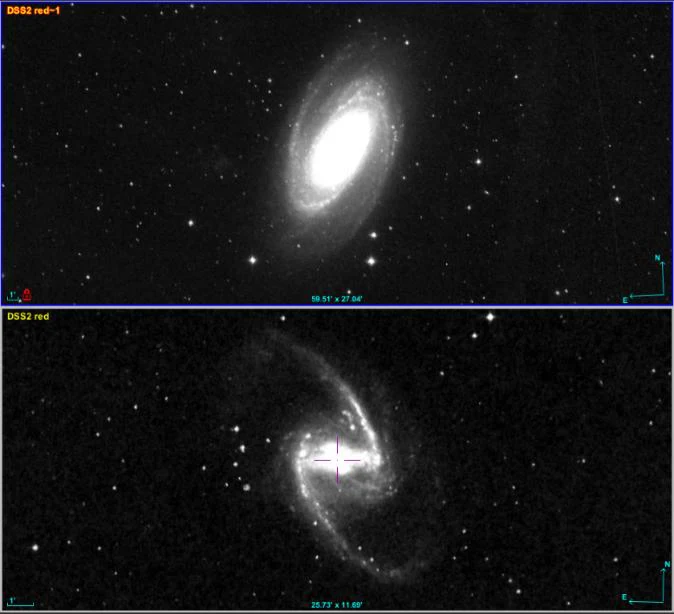
For the morphological analysis, optical images in the red band of the DSS2 survey were selected, which offer a good compromise between contrast and lower influence of dust. The images were enhanced with a logarithmic contrast stretch, which evenly highlights the brightness gradient from the nucleus to the disc without saturating the central regions. This makes the global structure of both galaxies easier to see and leaves the images ready for the subsequent analysis.
The isophote analysis was then carried out with the Contour Plot tool, choosing 8 contours from the histogram of intensity values in the image. Each contour is an isophote, that is, a line joining regions with the same brightness level. Visual inspection of the shape, elongation and orientation of these isophotes makes it possible to characterise the internal structure of the galaxy and to assess whether a central bar may be present.
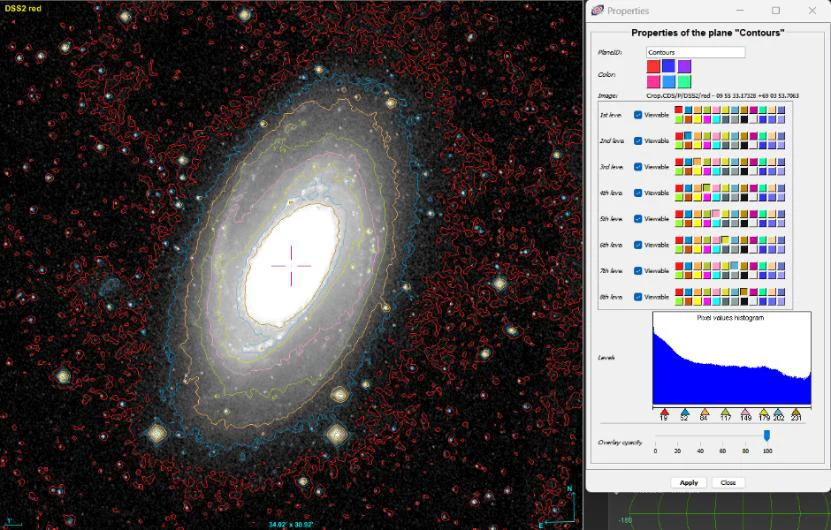
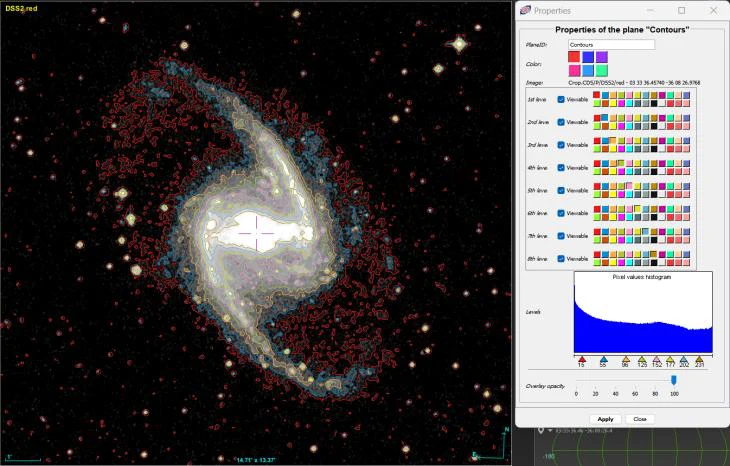
The isophote analysis of M81 shows roughly elliptical, concentric contours, with a smooth, continuous variation of ellipticity and position angle as the radius increases. There is no inner region with strongly elongated isophotes or a constant orientation that could be associated with a bar. This behaviour is consistent with an unbarred spiral galaxy, in which the light distribution is dominated by a central bulge and a disc, with no clearly defined inner elongated structure.
In contrast, the isophote analysis of NGC 1365 reveals a clear barred structure. The inner isophotes are significantly elongated and keep a roughly constant position angle, which shows a dominant stellar bar. At larger radii the shape of the isophotes changes: the ellipticity decreases and the position angle varies, which indicates the transition from the bar to the disc and the spiral arms. This behaviour is characteristic of barred spirals and contrasts with that of M81, which has no central elongated structure.
To obtain the redshift and the apparent magnitude in the V band, the Simbad record of each object was accessed from Aladin (option Astronomical Object Exploration, Simbad and VizieR). Table 1 lists the values obtained.
| Galaxy | Redshift (z) | V magnitude |
|---|---|---|
| M81 | −0.00016 [0.00007] | 6.94 [0.03] D |
| NGC 1365 | 0.00509060 [0.0005] | 9.63 [0.07] D |
Table 1. Redshift and V-band magnitude values for M81 and NGC 1365.
M81
The redshift of M81 is negative, which indicates that its radial velocity is dominated by local gravitational motions (peculiar velocity) rather than by the expansion of the universe. In this case the Hubble law cannot be applied to convert the redshift into a distance, since the contribution of cosmological expansion is negligible compared with the “traffic” of the Local Group.
For this reason, the distance to M81 is estimated with redshift-independent measurements, obtained from classical distance indicators (Cepheids, TRGB, supernovae, among others). Specifically, the NED-D catalogue available in Aladin was used, which compiles extragalactic distances published in the literature (Steer et al., 2020). Of the various estimates in the catalogue, the median is adopted as the representative value:
d = 3.65 ± 0.19 Mpc
With this distance, the distance modulus is calculated:
μ = 5 · log₁₀(d / 10 pc) = 5 · log₁₀(3.65 × 10⁶ pc / 10 pc) ≃ 27.81
With the apparent magnitude in the V band, mV = 6.94 (Simbad), the absolute magnitude of M81 is estimated:
MV = mV − μ = 6.94 − 27.81 = −20.87
Finally, the V-band luminosity is calculated in solar units, adopting MV,☉ = 4.83:
LV / LV,☉ = 10−0.4 (MV − MV,☉) = 10−0.4 (−20.87 − 4.83) → LV ≈ 1.9 × 10¹⁰ LV,☉
NGC 1365
For the barred spiral NGC 1365, the distance can be estimated with the Hubble law, because its redshift is positive and small: its velocity is dominated by the expansion and v ≈ cz is a good approximation. With the Simbad data in Table 1:
v ≈ cz = (299,792 km/s) · (0.00509060) = 1526.1211 km/s
The Hubble-law distance is v = H₀ · d, hence d = v / H₀. This work adopts H₀ = 70 km s⁻¹ Mpc⁻¹, an intermediate value widely used in teaching calculations, bearing in mind the so-called Hubble tension: the discrepancy between the measurements of H₀ obtained from the early universe (cosmic microwave background) and those obtained with local distance indicators. This choice allows a representative estimate without introducing a significant bias into the analysis:
d = 1526.1211 km/s / 70 km s⁻¹ Mpc⁻¹ = 21.80 Mpc = 21.80 × 10⁶ pc
The distance obtained, d = 21.8 Mpc, is consistent with values in the literature, such as the 21.84 Mpc estimated with line-width relations and peculiar flow (Crook et al., 2007). It is, however, somewhat larger than the redshift-independent distances compiled in NED-D (Cepheids and TRGB, about 18 Mpc; Steer et al., 2020): NGC 1365 belongs to the Fornax cluster and, at this distance, its peculiar velocity is not negligible compared with the Hubble flow. The distance modulus is:
μ = 5 · log₁₀(21.80 × 10⁶ pc / 10 pc) = 5 · (log₁₀(21.80 × 10⁶) − 1) = 31.69
The absolute magnitude:
MV = mV − μ = 9.63 − 31.69 = −22.06
And, applying again the relation between magnitudes and luminosity with MV,☉ = 4.83:
LV / LV,☉ = 100.4 (MV,☉ − MV) = 100.4 (4.83 + 22.06) → LV ≈ 5.7 × 10¹⁰ LV,☉
Comparing the absolute magnitudes in the V band, NGC 1365 (MV = −22.06) is brighter than M81 (MV ≈ −20.87): the difference ΔM = 1.19 is equivalent to a factor of ~3 in luminosity, which indicates that NGC 1365 is about three times more luminous than M81 in this band. The V-band luminosities obtained confirm that factor: 5.7 × 10¹⁰ / 1.9 × 10¹⁰ ≈ 3.
From the isophote analysis and the estimate of distances and luminosities, the morphological and physical behaviour of an unbarred spiral galaxy (M81) and a barred spiral (NGC 1365) were clearly distinguished. The morphological analysis made it possible to identify the presence or absence of a central stellar bar, while the combined use of apparent magnitudes and distances (obtained with redshift-independent methods or with the Hubble law, as appropriate) made it possible to derive their absolute magnitudes and luminosities. These results illustrate how morphological analysis and distance-determination methods complement each other in the study of nearby galaxies.
3. Ellipticity and equivalent radius of M60 from isophotes
Elliptical galaxies are characterised by a smooth, roughly ellipsoidal brightness distribution, without internal structures such as discs or spiral arms. Isophote analysis is a fundamental tool for quantifying their shape and determining geometric parameters such as ellipticity and equivalent radius.
The elliptical galaxy M60 was analysed with SDSS colour images. M60 has a smooth, symmetric brightness distribution, dominated by old stellar populations, which allows well-behaved isophotes to be defined regardless of the band used. The analysis was again done with Aladin’s Contour Plot tool, this time with 12 brightness levels (Figure 6). The contours have a regular, concentric elliptical shape, without abrupt changes of orientation, a behaviour characteristic of elliptical galaxies.
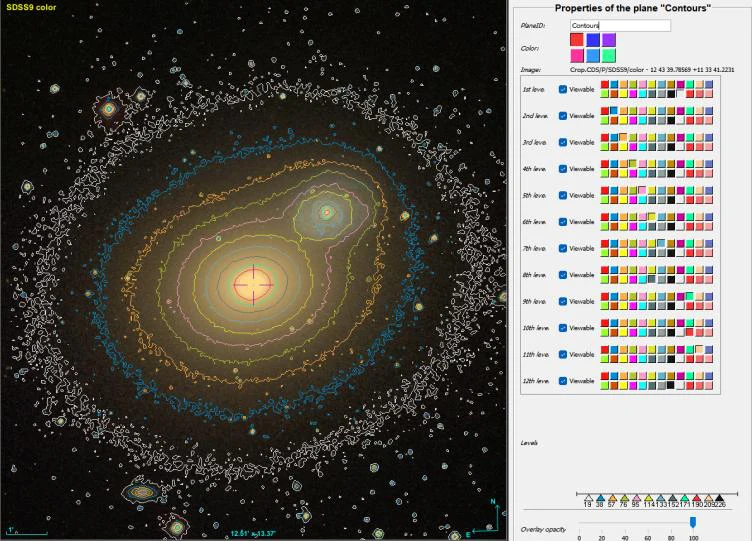
To quantify the shape of the galaxy, an intermediate isophote was selected (marked in red), representative of the global structure and not dominated by the central nucleus. Its semi-major and semi-minor axes were measured:
a = 52.72″ b = 44.6″
The ellipticity was calculated as:
ε = 1 − b/a ≈ 0.15
This value is consistent with a low-elongation elliptical galaxy, in agreement with the morphological classification of M60. The equivalent radius was also calculated, defined as the radius of the circle with the same area as the ellipse considered:
Req = √(a · b) ≈ 48.5″
These parameters describe the geometry of M60 quantitatively and confirm its regular elliptical nature.
4. Distance to NGC 7331 and its H-band magnitude with the Tully–Fisher relation
To obtain the distance to a galaxy from magnitudes, its apparent magnitude m and absolute magnitude M must be known; they are related through the distance modulus:
μ = m − M = 5 · log₁₀(d / 10 pc)
For distant galaxies, the absolute magnitude is not directly observable and must be estimated from empirical relations that link internal physical properties with luminosity. For spiral galaxies, one of the most widely used methods is the Tully–Fisher relation, which links the intrinsic luminosity of the galaxy with its rotation velocity. Physically, it reflects the fact that more massive galaxies rotate faster and are therefore more luminous.
The rotation velocity can be estimated from the profile of the 21 cm line of neutral hydrogen (HI). In a rotating spiral galaxy, the gas in the disc moves towards and away from the observer, which produces a characteristic broadening of the line, typically with a double-horned shape. The width of the profile measured at 50 % of the peak height, W50, is used as an indicator of the projected rotation velocity of the disc.
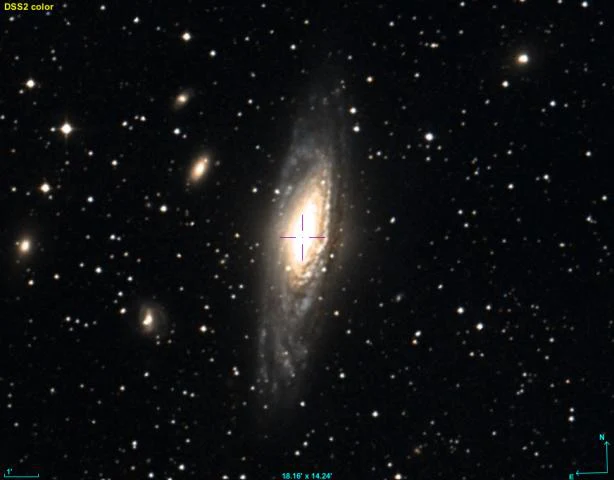
For NGC 7331, the width of the HI profile was taken from the ALFALFA catalogue of extragalactic HI sources (Haynes et al., 2018):
W50 = 503 ± 2 km s⁻¹
This W50 is the observed (projected) width: if the galaxy is inclined, “less” velocity is seen than if it were observed edge-on. The inclination-corrected width is therefore needed.
The apparent magnitude in the H band was taken from the 2MASS XSC catalogue (2MASX). The extinction-corrected magnitude was used, because it already includes the correction for Galactic extinction and avoids adding a separate correction:
mH = mext = 6.294 ± 0.017
From the same catalogue, the inclination i is derived from the axis ratio q = b/a. A standard way of going from q to the inclination is:
cos² i = (q² − q₀²) / (1 − q₀²)
where q₀ is the intrinsic thickness of the disc, typically q₀ ≈ 0.2 for spirals (Kourkchi et al., 2020). With q = 0.539 and q₀ = 0.2:
i ≈ 59.3° sin i ≈ 0.860
Pierce and Tully (1992) calibrated the Tully–Fisher relation in several photometric bands, including the H band, with an expression that relates the inclination-corrected line width to the absolute magnitude. This width is the line width corrected for instrumental effects and for the inclination of the disc (Kourkchi et al., 2020). As a first approximation, for NGC 7331 the following is adopted:
WRi ≈ W50 / sin i ≈ 503 / 0.860 ≈ 584.9 km/s
MHb,i = −9.50 · (log WRi − 2.50) − 21.67 ± 0.08
The absolute magnitude in the H band can now be calculated:
log W = log(584.9) ≈ 2.767 MH ≈ −9.50 · (2.767 − 2.50) − 21.67 ≈ −24.207
With the apparent and absolute magnitudes known, the distance modulus is obtained:
μ = mH − MH = 6.294 − (−24.207) = 30.50
And from it, the distance:
d (pc) = 10(μ + 5) / 5 = 10(30.50 + 5) / 5 → d ≈ 12.6 Mpc
The galaxy NGC 7331 therefore lies at about 12.6 Mpc. This distance, obtained with the Tully–Fisher relation, is consistent with the values published using the same method: it agrees, within the uncertainties, with the estimates that place the galaxy between ~11.4 and 13.6 Mpc (Kourkchi et al., 2020; Kourkchi et al., 2022; Tully et al., 2008), which supports the validity of the calculation.
References
- Conselice, C. J. (2014). The evolution of galaxy structure over cosmic time. Annual Review of Astronomy and Astrophysics, 52, 291–337.
- Crook, A. C., Huchra, J. P., Martimbeau, N., Masters, K. L., Jarrett, T., & Macri, L. M. (2007). Groups of galaxies in the Two Micron All Sky Redshift Survey. The Astrophysical Journal, 655(2), 790–813.
- Haynes, M. P., Giovanelli, R., Kent, B. R., et al. (2018). The Arecibo Legacy Fast ALFA Survey: The ALFALFA extragalactic H I source catalog. The Astrophysical Journal, 861(1), 49.
- Kourkchi, E., Tully, R. B., Graziani, R., et al. (2020). Cosmicflows-4: The catalog of ∼10,000 Tully–Fisher distances. The Astrophysical Journal, 902(2), 145.
- Kourkchi, E., Tully, R. B., Courtois, H. M., et al. (2022). Cosmicflows-4: The baryonic Tully–Fisher relation providing ∼10,000 distances. Monthly Notices of the Royal Astronomical Society, 511(4), 6160.
- Pierce, M. J., & Tully, R. B. (1992). Luminosity–line width relations and the extragalactic distance scale. I. Absolute calibration. The Astrophysical Journal, 387, 47–62.
- Sparke, L. S., & Gallagher, J. S. (2007). Galaxies in the Universe: An Introduction (2nd ed.). Cambridge University Press.
- Steer, I., Madore, B. F., & Freedman, W. L. (2020). The NASA/IPAC Extragalactic Database Distances (NED-D): Redshift-independent distances to galaxies.
- Tully, R. B., Shaya, E. J., Karachentsev, I. D., Courtois, H. M., Kocevski, D. D., Rizzi, L., & Peel, A. (2008). Our peculiar motion away from the Local Void. The Astrophysical Journal, 676(1), 184–205.