Stellar astrophysics · UNIR
Study of a star cluster: the Pleiades with Gaia DR3
ADQL query to the Gaia DR3 archive, iterative selection of cluster members by parallax and proper motion, calculation of the distance and its error, SED fitting with VOSA and construction of the HR diagram.

Retrieving the Gaia DR3 data
For the study of the Pleiades star cluster, the Gaia DR3 archive was queried from TOPCAT, using ESA’s TAP service asynchronously and the ADQL language. The query selects all objects within 5 degrees of the cluster centre and applies astrometric quality criteria requiring relative errors below 10 % in the parallax and in both proper-motion components (pmra and pmdec), together with a photometric limit of G < 14. These filters ensure an initial data set with reliable measurements, suitable for identifying the cluster members afterwards.
SELECT source_id, ra, dec, parallax, parallax_error, pmra, pmra_error,
       pmdec, pmdec_error, phot_g_mean_mag
FROM gaiadr3.gaia_source
WHERE 1 = CONTAINS(POINT('ICRS', ra, dec), CIRCLE('ICRS', 56.75, 24.12, 5))
  AND phot_g_mean_mag < 14
  AND parallax IS NOT NULL AND parallax_error IS NOT NULL AND parallax != 0
  AND pmra IS NOT NULL AND pmra_error IS NOT NULL AND pmra != 0
  AND pmdec IS NOT NULL AND pmdec_error IS NOT NULL AND pmdec != 0
  AND ABS(parallax_error / parallax) < 0.1
  AND ABS(pmra_error / pmra) < 0.1
  AND ABS(pmdec_error / pmdec) < 0.1
Selection of the cluster members
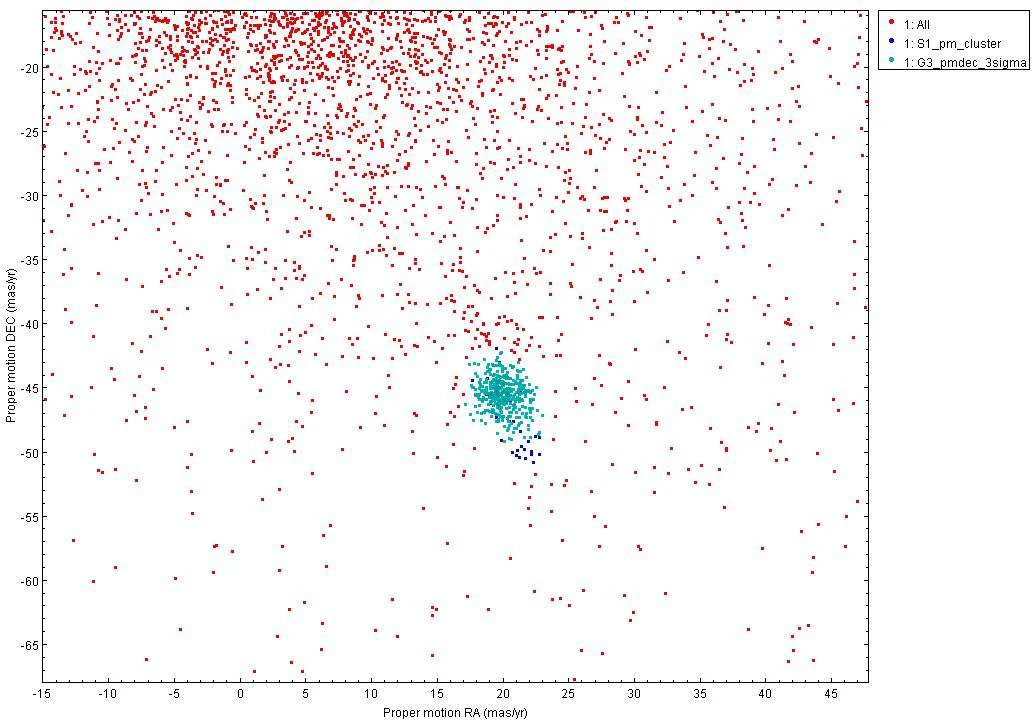
The cluster members were selected iteratively by applying ±3σ cuts on parallax, pmra and pmdec. After three iterations, the number of sources stabilised at N = 371, with no change when the filters were applied again, which indicates that the procedure had converged. The final subset adopted as cluster members is G3_pmdec_3sigma.
Distance to the cluster
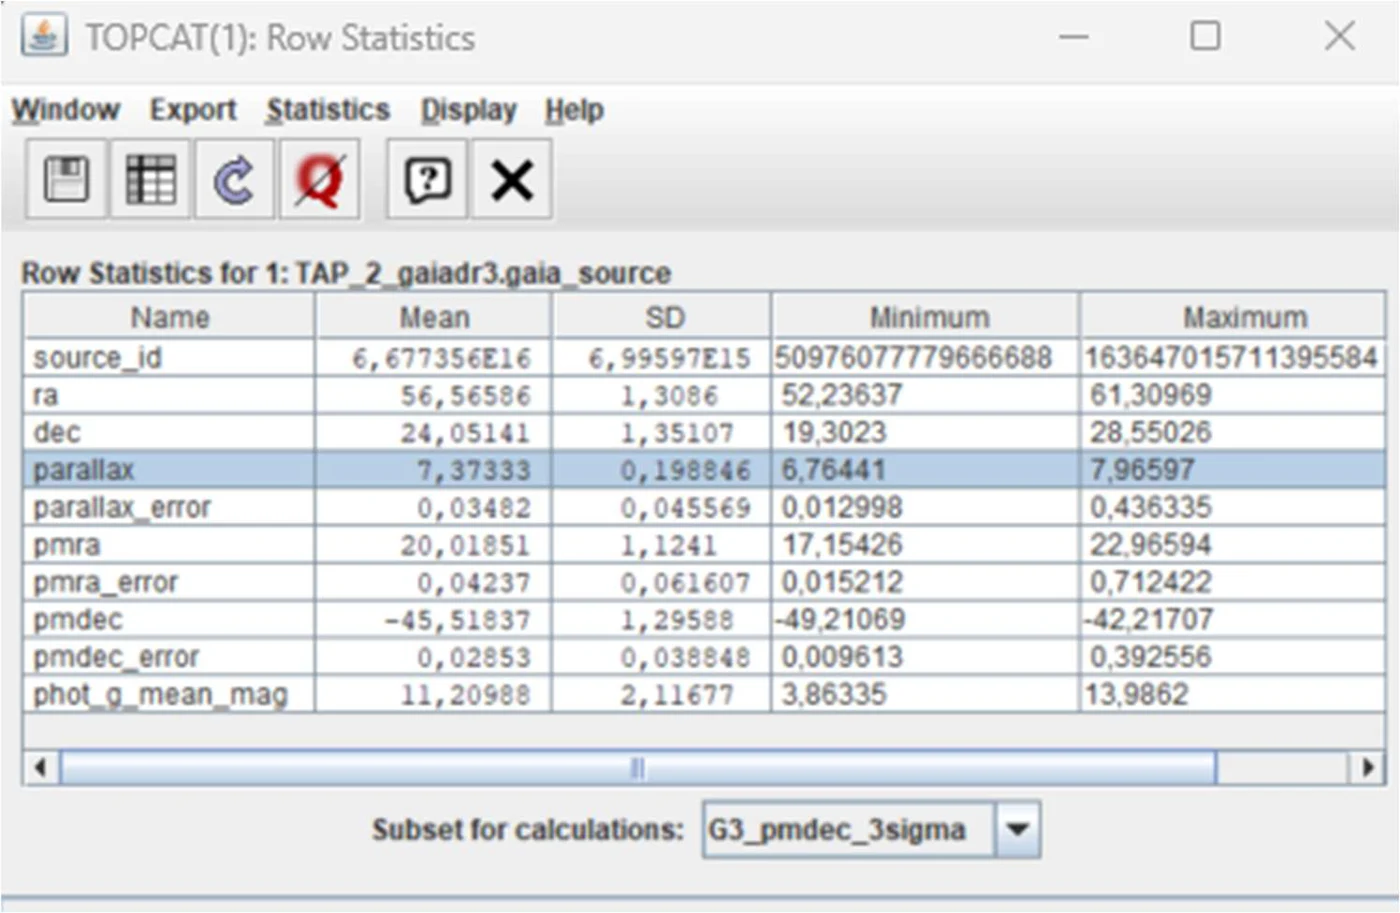
From the last iteration (subset G3_pmdec_3sigma, Figure 2), the mean parallax and its standard deviation are obtained for the 371 selected objects:
- Mean parallax: ϖ̄ = 7.37333 mas
- Standard deviation: σϖ = 0.19864 mas
- Number of objects: N = 371
1. Error of the mean parallax:
σϖ̄ = σϖ / √N = 0.19864 / √371 = 0.0103 mas
2. Distance to the cluster:
d (pc) = 1000 / ϖ̄ (mas) = 1000 / 7.37333 = 135.6 pc
3. Error in the distance:
σd = (1000 / ϖ̄²) · σϖ̄ = (1000 / 7.37333²) · 0.0103 = 0.19 pc
The factor 1000 appears because the parallax is expressed in milliarcseconds: the fundamental relation d (pc) = 1 / ϖ (″) becomes d (pc) = 1000 / ϖ (mas).
The mean parallax of the final subset of members is ϖ̄ = 7.373 ± 0.010 mas, where the error is the error of the mean. The distance to the cluster, estimated as d = 1000/ϖ̄, is:
d = 135.6 ± 0.2 pc (≈ 442.3 ± 0.6 light years)
The ±0.2 pc error is statistical only: it does not include the systematic bias of the Gaia DR3 parallax zero point (≈ −0.017 mas; Lindegren et al., 2021), which at this distance amounts to about 0.3 pc. This value is consistent, within the uncertainties, with recent results in the literature based on Gaia DR2 and DR3, which place the Pleiades at around 135–136 pc (Gaia Collaboration et al., 2018; Breuval et al., 2025). As an independent check, an iterative selection carried out in parallel with Gaussian fits in parallax and proper motions gave a mean parallax of ϖ ≃ 7.35 mas, equivalent to a distance of ≃ 136 pc, which confirms the robustness of the method.
Building and analysing the SEDs in VOSA
The spectral energy distributions (SEDs) of the cluster members were built from GALEX, Gaia DR3, 2MASS and WISE photometry, and fitted with Kurucz stellar atmosphere models (α = 0.0) in VOSA. The fits adequately reproduce a population of main-sequence stars of spectral types F to M, with low interstellar extinction and no evidence of significant infrared excess.
A small number of objects without a distance in Gaia DR3 were excluded from the analysis. The occasional absence of Pan-STARRS photometry, caused by temporary problems with the Virtual Observatory service, does not affect the overall results. After the initial fit, the treatment of infrared excess was refined by excluding the WISE photometric points that exceeded the photospheric emission, which gave more robust stellar parameters. The final results were exported to TOPCAT via SAMP for further analysis.
Building the HR diagram in TOPCAT
To select the reliable fits, the distribution of the χ² statistic was analysed with a histogram on a logarithmic scale, and a threshold of χ² ≤ 10 was adopted to exclude poor fits. The HR diagram was built in TOPCAT with the effective temperature (Teff) and the bolometric luminosity (Lbol) obtained from the SED fits, considering only the objects with χ² ≤ 10.
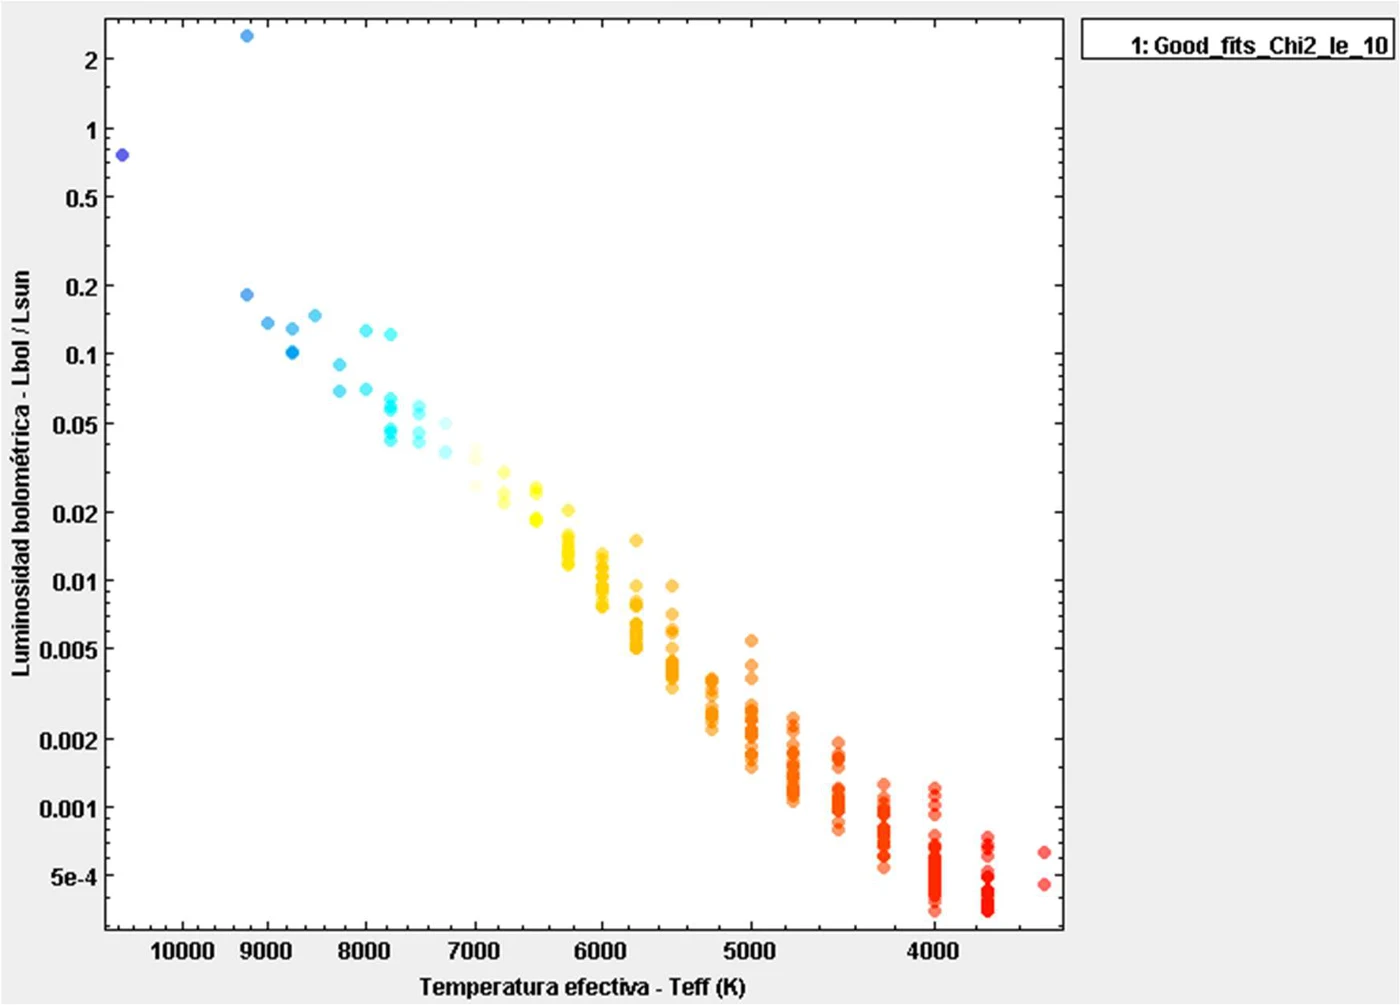
The diagram shows a well-defined main sequence, with the hottest and most luminous stars in the upper left and the coolest and least luminous towards the lower right. The small scatter around the sequence indicates a stellar population that is homogeneous in age and chemical composition, consistent with the young, nearby nature of the Pleiades cluster.
References
- Breuval, L., Anand, G. S., Anderson, R. I., et al. (2025). Converging on the Cepheid metallicity dependence: Implications of nonstandard Gaia parallax recalibration on distance measures. The Astrophysical Journal, 994(1), 111.
- Gaia Collaboration, Babusiaux, C., van Leeuwen, F., et al. (2018). Gaia Data Release 2: Observational Hertzsprung–Russell diagrams. Astronomy & Astrophysics, 616, A10.
- Lindegren, L., Bastian, U., Biermann, M., et al. (2021). Gaia Early Data Release 3: Parallax bias versus magnitude, colour, and position. Astronomy & Astrophysics, 649, A4.