High energies · UNIR
A multi-instrument spectrum: Fermi-LAT and H.E.S.S. on three gamma-ray sources
Cross-identification of the 3FHL (Fermi-LAT) and HGPS (H.E.S.S.) catalogues with Gammapy and joint spectral fitting of three sources of different nature with a power law, a log-parabola and a power law with an exponential cut-off.

Introduction
To study the most extreme universe, gamma-ray astronomy works as a team: it combines space and ground-based telescopes to capture an enormous range of energies. This alliance makes it possible to reconstruct the spectral energy distribution (SED) of different cosmic sources, and those plots carry the signature of fascinating physical processes: from particles accelerated in violent shock waves or slowed down in magnetic fields to very-high-energy photons that disappear when they collide with the extragalactic “fog” of light (Aharonian et al., 2006; Atwood et al., 2009).
In this work, information from two large catalogues, the space-based 3FHL (Fermi-LAT) and the ground-based HGPS (H.E.S.S.), is cross-matched with the Gammapy tool (Donath et al., 2023). Three mathematical models (power law, log-parabola and power law with an exponential cut-off) are tested on three celestial objects of completely different nature. The main aim is to reproduce these calculations step by step in a Python notebook, rigorously assessing whether the statistical model chosen manages to tell the true physical story of each source, in line with the scientific literature.
Detectors
Fermi-LAT (Large Area Telescope)
The LAT is the main “eye” of the Fermi satellite, a NASA and DOE mission that has orbited the Earth at about 565 km altitude since 2008. From that privileged position it works as a constant scanner that maps the whole sky every three hours (Atwood et al., 2009). It captures high-energy photons, between 20 MeV and more than 300 GeV, and bridges what X-ray telescopes observe and what ground-based Cherenkov observatories capture.
It does not use traditional mirrors but a phenomenon called pair conversion: when a gamma ray enters the detector, it hits thin tungsten foils and is transformed into an electron–positron pair. Silicon strips track the exact path of these particles, while a calorimeter at the end of their path measures the energy they have left. This design allows an angular resolution of ≲ 0.1° above 10 GeV and the study of active galactic nuclei, pulsars, supernova remnants and gamma-ray bursts (Atwood et al., 2009).
H.E.S.S. (High Energy Stereoscopic System)
H.E.S.S. is a system of imaging atmospheric Cherenkov telescopes (IACT) located on the Khomas Highland in Namibia, 1800 metres above sea level. It has been operating since 2003 and is optimised for very-high-energy (VHE) astronomy, between 100 GeV and several tens of TeV (Aharonian et al., 2006). The original system consists of four telescopes with 12 m mirrors and 960-phototube cameras, placed at the corners of a square 120 m on a side. In 2012 a fifth, 28-metre telescope was installed in the centre, which increases the sensitivity and can capture signals from 0.1 to 100 TeV; its camera was upgraded in 2019 with a prototype of the new cameras designed for the next-generation CTAO observatory, able to digitise the analogue signals at 250 million samples per second with 12-bit resolution.
Unlike the LAT, H.E.S.S. does not detect photons directly but uses the atmosphere itself as the conversion medium. When a TeV gamma ray enters the atmosphere, it starts an electromagnetic cascade whose particles, travelling faster than light does in air, emit a blue flash of Cherenkov radiation lasting a few nanoseconds. Because the four telescopes observe the sky at the same time from different positions, they capture this flash from several angles, which makes it possible to reconstruct the axis of the cascade stereoscopically and, with it, the direction of origin and the energy of the primary photon (Aharonian et al., 2006).
The catalogues used
Fermi-LAT 3FHL catalogue. The Third Catalog of Hard Fermi-LAT Sources (3FHL) is essentially a large census of the most energetic sources in the sky. It contains 1556 objects detected above 10 GeV in the first 7 years of the mission, thanks to a major update of the data processing known as Pass 8 (Ajello et al., 2017). This catalogue is built from photons between 10 GeV and 2 TeV and is so sensitive that it can detect signals equivalent to 0.5 % of the brightness of the Crab Nebula, the traditional “standard candle” of high-energy astronomy. For each object, the catalogue provides its “identity card”: exact position, error margin, spectral index and astrophysical family (pulsars, supernova remnants, active galaxies, etc.). A revealing fact is that 79 % of these sources lie outside the Milky Way, which shows Fermi’s great ability to detect distant blazars.
H.E.S.S. HGPS catalogue. The H.E.S.S. Galactic Plane Survey (HGPS) is the first panoramic map of the “equator” of our galaxy at extreme energies. It is the result of a decade of observations (2004–2013), with about 2700 hours of direct observation of the Galactic plane (H.E.S.S. Collaboration et al., 2018). With a resolution of 0.08°, it covers energies from 0.2 to 100 TeV and contains 78 sources. One of its most valuable tools is a special column (Identified_Object) that works as a “matchmaker”: it indicates whether the source captured by H.E.S.S. is already known at other wavelengths, which greatly simplifies cross-matching with external catalogues such as the 3FHL.
Relevant information from each catalogue. Exploring these databases with Gammapy, the essential “ingredients” of the work were extracted: the names and precise coordinates (Source_Name and positions), the astrophysical nature of the object (CLASS) and its known counterparts (Identified_Object). The real star, however, is the column of spectral points (flux_points): it holds the exact record of how much light arrives at each energy level, with its error bars and upper limits. These points are the raw material from which the data sets (FluxPointsDataset) are built to feed and test the models.
Cross-identification (xmatch)
To find out which objects were observed by both surveys, a cross-identification was carried out. It started with a classical brute-force method, of cost O(n · m): the code measures the distance from each object to all those in the other catalogue and keeps only the “neighbours” separated by less than 0.1°. The process was then modernised with the official tool of the Astropy library, which uses a much more efficient search algorithm called a KD tree. Both routes led to the same result: 31 pairs less than 0.1° apart, most of them almost perfectly superimposed, separated by just 0.006° to 0.082°.
To check that these pairs were not mere coincidences of perspective, the H.E.S.S. Identified_Object column was used. The result confirmed the validity of the cross-match: in 17 of the 31 matches, both catalogues pointed to famous, already identified objects (such as Vela Junior, RCW 86, MSH 15-52, PSR J1119−6127 or LS 5039), which shows statistically that it is not chance. In addition, the astrophysical families match excellently (supernova remnants with supernova remnants [SNR–SNR] or binary systems [HMB–Binary]). The only small discrepancies arise when H.E.S.S. still lists the object as “unidentified” (Unid) but Fermi (3FHL) has already assigned it a label.
Selection of sources for the spectral analysis
To show that the universe has more than one way of accelerating particles, three candidates were chosen from the list of matches, each from a completely different astrophysical family, which ensures a rich variety of physical phenomena.
| Index | Fermi (3FHL) | H.E.S.S. (HGPS) | Identification | HGPS class | Δθ |
|---|---|---|---|---|---|
| 11 | 3FHL J1640.6−4633 | HESS J1640−465 | G338.3−0.0 (composite remnant) | Composite | 0.015° |
| 13 | 3FHL J1713.5−3945e | HESS J1713−397 | RX J1713.7−3946 (shell remnant) | SNR | 0.029° |
| 30 | 3FHL J1943.9+2117 | HESS J1943+213 | Extragalactic EHBL blazar | Unid | 0.026° |
Table 1. Sources selected for the spectral fit, with their indices in the 3FHL × HGPS cross-match.
Spectral models used
To read the story the data tell, three parametric models were used. All of them describe how many photons arrive (the differential flux dN/dE) at different energy levels (E).
1. Power law (PL). This is the most basic model, equivalent to drawing a straight line on logarithmic plots:
dN/dE = N₀ · (E / E₀)−Γ
where N₀ is the normalised amplitude, E₀ the reference point (fixed at 1 TeV) and Γ the slope (spectral index).
2. Log-parabola (LP). When the straight line is not enough, the curve is allowed to bend to create smooth peaks or drops:
dN/dE = N₀ · (E / E₀)−α − β ln(E/E₀)
In this case, α still measures the initial slope and the parameter β is added, acting as a “steering wheel” that controls the curvature.
3. Power law with exponential cut-off (ECPL). This is the ideal tool when the universe puts an abrupt brake on the particles:
dN/dE = N₀ · (E / E₀)−Γ · exp(−λE)
A fall-off factor controlled by λ = 1/Ec, the inverse of the maximum energy (Ec) that the object can reach before switching off or letting the energy escape, is added to the basic straight line.
The models were fitted with the Minuit minimiser, integrated in Gammapy, which minimises an asymmetric χ² statistic: a careful approach that takes into account that, in astrophysics, error bars are not always the same upwards and downwards. To assess whether the chosen model is the right one, the reduced χ² (χ²/NDoF) and the total sum of the residuals were calculated; the latter quantifies the absolute deviations between the theoretical curve and the measurements.
Case 1: G338.3−0.0 (3FHL J1640.6−4633 + HESS J1640−465)
Nature of the object. G338.3−0.0 is a composite supernova remnant, located between 8 and 13 kpc away, the vestige of a stellar explosion that took place some 10,000 to 30,000 years ago (Castelletti et al., 2011). Inside it there is a hyperactive engine: the young pulsar PSR J1640−4631, discovered by the NuSTAR satellite (Gotthelf et al., 2014), wrapped in a violent “cloud” of particles known as a pulsar wind nebula (PWN). The light that reaches Fermi and H.E.S.S. comes almost entirely from this central nebula, with a much smaller contribution from the outer shell of the original explosion. Its Fermi-LAT GeV spectrum connects with the H.E.S.S. data (Lemoine-Goumard et al., 2014).
Spectral fits carried out. The models were tested in the following order: first, a power law (PL) with the H.E.S.S. data only; then, that same straight line forced to explain both catalogues at once (joint fit); third, a joint log-parabola (LP); and finally, a combination of both approaches (PL + LP).
| Model | Key parameters | Total χ² | NDoF | χ²r |
|---|---|---|---|---|
| PL (H.E.S.S. only) | Γ = 2.54 ± 0.04 | 17.58 | 4 | 4.40 |
| Joint PL | Γ = 2.18 ± 0.01 | 176.93 | 9 | 19.66 |
| Joint LP (chosen) | α = 2.44 ± 0.04; β = 0.133 ± 0.014 | 7.31 | 8 | 0.91 |
| PL + LP (composite) | Γ ≈ 2.45 ± 0.48 | 5.42 | 6 | 0.90 |
Table 2. Statistics of the models tested on G338.3−0.0.
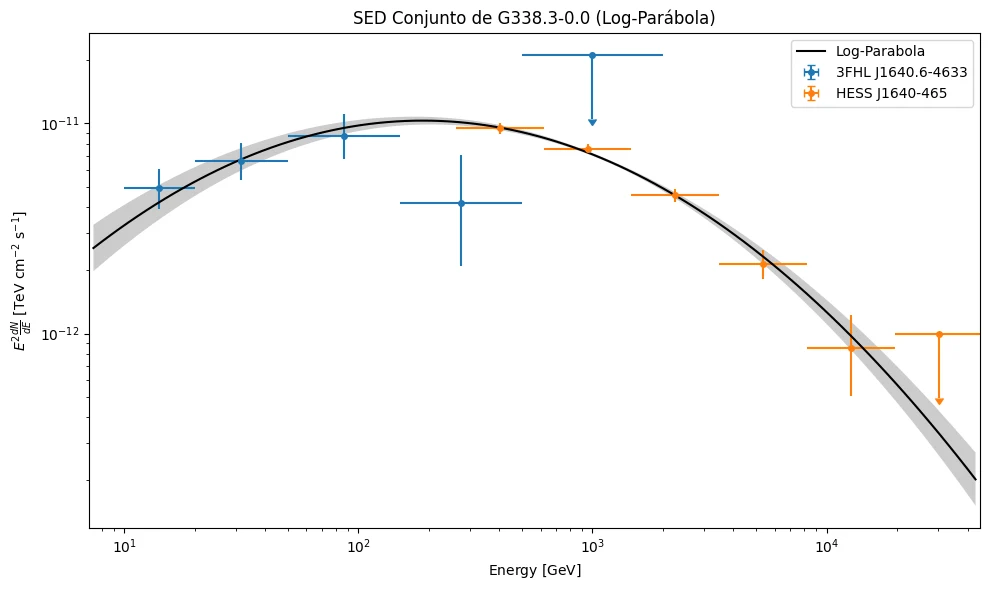
Discussion and conclusion. The first power law seemed to describe the steep fall of the H.E.S.S. data quite well (with an index of 2.54). However, when the algorithm was asked to use a straight line to average both telescopes at once, the statistical error shot up completely, with a reduced χ² of 19.66. Visually, the line projected a huge excess of GeV photons that Fermi never detected, ruining the model at both ends.
Far from being a problem, this mathematical “failure” agrees with the documented physics of pulsar wind nebulae: it is known empirically that their spectra are not continuous lines but show a natural curvature, because the electron population trapped in them loses energy and “ages” over time (Gaensler and Slane, 2006). With the log-parabola, the discrepancy was resolved impeccably and an excellent fit value of 0.91 was reached. The parameter responsible for this success is β (0.133), which draws the characteristic “mountain” shape of the plot. This dome reflects how the electrons lose energy quickly by interacting with magnetic fields (synchrotron cooling) or with other photons (inverse Compton), which shows that the nebula’s accelerator, the termination shock of the pulsar wind, has a clear limit for accelerating particles (Gaensler and Slane, 2006).
Finally, it was checked whether adding two models at once (PL + LP) improved the situation. Although the error dropped to 0.90, the algorithm returned a practically zero amplitude for the straight-line component: clear evidence of overfitting, that is, of unnecessary mathematical complexity. Applying the principle that the simplest explanation is usually the right one, the log-parabola was selected as the final and optimal model for this source.
Case 2: RX J1713.7−3946 (3FHL J1713.5−3945e + HESS J1713−397)
Nature of the object. RX J1713.7−3946 (also catalogued as G347.3−0.5) is the huge expanding shell of a star that exploded, originally discovered in X-rays by the ROSAT satellite. It is now considered one of the most famous and most studied Galactic particle accelerators. Its gamma-ray emission spans three orders of magnitude and reaches ~100 TeV, but its brightness does not rise or fall in a straight line: it shows a clear break at high energies (Aharonian et al., 2006; H.E.S.S. Collaboration et al., 2018a). All this energy comes from particles violently accelerated by the supernova shock wave. In addition, this shock front collides with surrounding molecular gas clouds, which fuels a constant debate on whether the observed light is the product of proton (hadronic) or electron (leptonic) interactions.
Spectral fits carried out. Three scenarios were compared: first, a power law (PL) with the H.E.S.S. data only; then, that line forced to explain Fermi and H.E.S.S. at once; and finally, a power law with an exponential cut-off (ECPL) on all the data together.
| Model | Key parameters | Total χ² | NDoF | χ²r |
|---|---|---|---|---|
| PL (H.E.S.S. only) | Γ = 2.30 ± 0.01 | 248.34 | 28 | 8.87 |
| Joint PL | Γ = 2.12 ± 0.01 | 1007.08 | 33 | 30.52 |
| Joint ECPL (chosen) | Γ = 1.90 ± 0.01; λ = 0.1127 ± 0.007 TeV⁻¹ → Ec ≈ 8.87 TeV | 128.21 | 32 | 4.01 |
Table 3. Statistics of the models tested on RX J1713.7−3946.
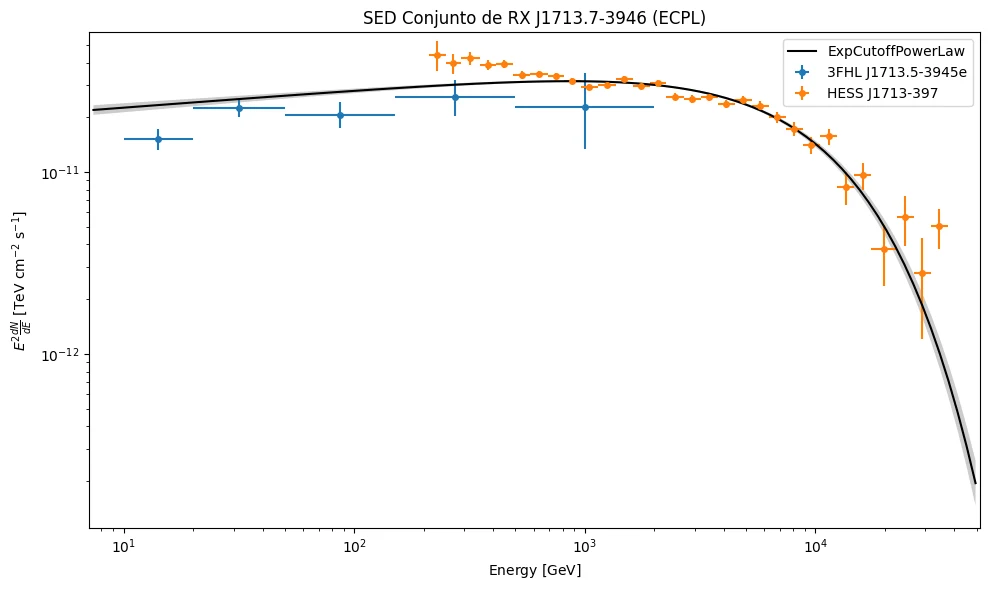
Discussion and conclusion. If the whole source is explained with a simple straight line (the global PL fit), the statistical rejection is absolute: a reduced χ² of 30.52. The model suffers from the “short blanket syndrome”: to get closer to the H.E.S.S. points, it predicts almost 10 times more GeV photons than Fermi actually detected and, at the same time, it passes above the last H.E.S.S. detections. As a result, the Fermi band alone accumulates about 90 % of the total error.
The ECPL model, on the other hand, resolves the conflict and reveals the physics of the remnant. It returns a “hard” intrinsic index (Γ = 1.90 ± 0.01), which confirms empirically that the shock wave is very efficient at injecting and accelerating particles (first-order diffusive mechanism). But the key player is the cut-off parameter: its inverse shows that the accelerator hits an energy “ceiling” at Ec ≈ 8.87 TeV, a value in line with the phenomenology reported by H.E.S.S. in its most exhaustive analyses of the source (Aharonian et al., 2007; H.E.S.S. Collaboration et al., 2018a).
Although the final reduced χ² of 4.01 is not the ideal theoretical value (1.0), it is perfectly expected given the circumstances: this remnant is not a laboratory sphere but an inhomogeneous, chaotic structure that interacts irregularly with molecular clouds, and a global analytical model cannot capture every local substructure of the gas. The great achievement of this fit is to show that RX J1713 works as an extremely efficient accelerator, but with a strict energy ceiling dictated by the magnetic confinement capacity of its own shell.
Case 3: HESS J1943+213 (3FHL J1943.9+2117)
Nature of the object. Discovered in 2011 by the HGPS, this object began as a mystery, labelled simply “Unid” (unidentified). Over time, thanks to the combined view of observatories such as VERITAS, VLBA, Swift and Fermi, its true identity has been revealed: it is a blazar, specifically of the EHBL subclass. That is, a supermassive black hole outside our galaxy whose jet of energy points almost directly towards us (H.E.S.S. Collaboration et al., 2011; Archer et al., 2018).
Being an extragalactic object, its light travels great cosmic distances to reach the Earth. On that journey, the highest-energy photons collide with the “fog” of the extragalactic background light (EBL) and annihilate, creating pairs (γ + γEBL → e⁺ + e⁻). The spectrum captured in the TeV band is therefore not the original brightness of the black hole’s engine, but only the residual light that managed to get through that opacity of the universe.
Spectral fits carried out. To model this attenuation, three scenarios were assessed: (i) a power law (PL) with the H.E.S.S. data only; (ii) a joint PL that tries to mediate between Fermi and H.E.S.S.; and, since these two scenarios did not give a good approximation, (iii) following the literature, a joint power law with exponential cut-off (ECPL) (Archer et al., 2018).
| Model | Key parameters | Total χ² | NDoF | χ²r |
|---|---|---|---|---|
| PL (H.E.S.S. only) | Γ = 2.52 ± 0.30 | 3.00 | 4 | 0.75 |
| Joint PL | Γ = 2.17 ± 0.06 | 10.86 | 9 | 1.21 |
| Joint ECPL (chosen) | Γ = 1.97 ± 0.11; λ = 0.43 ± 0.23 TeV⁻¹ → Ec ≈ 2.33 TeV | 6.69 | 8 | 0.84 |
Table 4. Statistics of the models tested on HESS J1943+213.
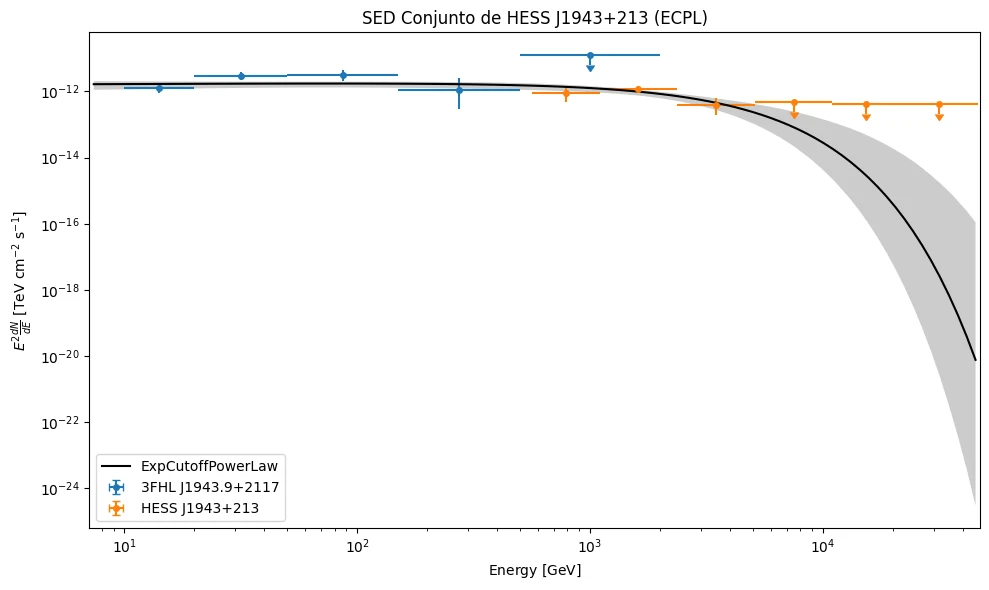
Discussion and conclusion. Here one of the greatest dangers of data analysis appears: the statistical false positive. Looking only at the table, the joint power law gives a reduced χ² of 1.21, apparently acceptable. In the plot, however, the theoretical line passes above the orange arrows (the upper limits set by H.E.S.S.) and does not manage to follow the gentle slope of the Fermi data either. This shows that a good χ² value is worthless if the model violates the physical constraints observed by the telescopes.
With the ECPL model, the conflict disappears. It returns an intrinsic index Γ = 1.97, which confirms that the original jet of the black hole is very “hard”, consistent with what Archer et al. (2018) report for this class of blazar. More importantly, the cut-off at Ec ≈ 2.33 TeV fits the attenuation expected from the EBL for a source at its probable cosmological distance (z ≲ 0.2; H.E.S.S. Collaboration et al., 2011). Unlike the previous case (the local supernova remnant), the great lesson of this source is that the exponential cut-off does not indicate that the central engine has run out of energy, but that it traces with mathematical precision the opacity of the intergalactic medium.
General conclusions
The journey through these three sources, combining the space-based Fermi-LAT data with the ground-based H.E.S.S. data, leaves a very clear lesson: there is no “master model” for everything. The optimal spectral model is never unique: it always depends on the intimate physics that dominates each object. Table 5 summarises the picture.
| Object | Nature | Optimal model | χ²r | Dominant mechanism |
|---|---|---|---|---|
| G338.3−0.0 | Composite remnant + PWN | Log-parabola | 0.91 | Radiative cooling of electrons |
| RX J1713.7−3946 | Shell remnant | ECPL (Ec ≈ 8.9 TeV) | 4.01 | Magnetic confinement limit |
| HESS J1943+213 | EHBL blazar (extragalactic) | ECPL (Ec ≈ 2.3 TeV) | 0.84 | EBL absorption |
Table 5. Summary of the results of the three spectral fits.
Comparing the behaviour of the telescopes separately with their joint work, several fundamental conclusions stand out:
- The straight line is no longer enough. No joint fit from the GeV band up to the TeV band admitted a simple power law. All three objects showed smooth curves or abrupt cut-offs, which shows that particle acceleration in the universe does not have an unlimited energy budget: there is always a physical brake.
- Beware of statistical mirages. Fitting a model looking only at H.E.S.S. (or only at Fermi) can give deceptively perfect numbers, such as the blazar’s reduced χ² of 0.75. However, when that same prediction is extended to the other energy band, the illusion breaks and the model fails. This underlines the enormous scientific value of combining complementary observatories to see the full picture.
- The same mathematics can tell completely different stories. The exponential cut-off model (ECPL) was the solution both for the supernova remnant (RX J1713) and for the blazar (HESS J1943). Physically, however, in the first it represented the maximum ceiling of the stellar engine (particles escaping above ~8.9 TeV), while in the second it traced the opaque fog of the universe itself absorbing the light. Statistics alone do not decide the physics: the numbers must always be interpreted with knowledge of the object’s environment.
- Watch out for overfitting. The test combining models (PL + LP) on G338.3−0.0 showed that forcing extra mathematical complexity barely improves the statistical error and even makes some parameters useless (the amplitude of the straight line fell practically to zero, by more than 2σ). Here Occam’s razor shines: in astronomy, the simplest explanation is usually the right one and the one that defines the optimal model.
Data and code availability
All the data used were obtained in the laboratory’s Jupyter notebook, which also includes comments on the process and the analysis carried out. Those comments are kept in the notebook because they were essential for understanding the physical processes of the sources and how the statistical metrics led to the conclusions presented here.
References
- Aharonian, F., et al. (2006). A detailed spectral and morphological study of the gamma-ray supernova remnant RX J1713.7−3946 with H.E.S.S. Astronomy & Astrophysics, 449(1), 223–242.
- Aharonian, F., et al. (2007). Primary particle acceleration above 100 TeV in the shell-type supernova remnant RX J1713.7−3946 with deep H.E.S.S. observations. Astronomy & Astrophysics, 464(1), 235–243.
- Ajello, M., et al. (2017). 3FHL: The third catalog of hard Fermi-LAT sources. The Astrophysical Journal Supplement Series, 232(2), 18.
- Archer, A., et al. (2018). HESS J1943+213: An extreme blazar shining through the Galactic plane. The Astrophysical Journal, 862(1), 41.
- Atwood, W. B., et al. (2009). The Large Area Telescope on the Fermi Gamma-ray Space Telescope mission. The Astrophysical Journal, 697(2), 1071–1102.
- Castelletti, G., Giacani, E., Dubner, G., Joshi, B. C., Rao, A. P., & Terrier, R. (2011). First high-resolution radio study of the supernova remnant G338.3−0.0 associated with the gamma-ray source HESS J1640−465. Astronomy & Astrophysics, 536, A98.
- Donath, A., et al. (2023). Gammapy: A Python package for gamma-ray astronomy. Astronomy & Astrophysics, 678, A157.
- Gaensler, B. M., & Slane, P. O. (2006). The evolution and structure of pulsar wind nebulae. Annual Review of Astronomy and Astrophysics, 44, 17–47.
- Gotthelf, E. V., et al. (2014). NuSTAR discovery of a young, energetic pulsar associated with the luminous gamma-ray source HESS J1640−465. The Astrophysical Journal, 788(2), 155.
- H.E.S.S. Collaboration, Abramowski, A., et al. (2011). HESS J1943+213: A candidate extreme BL Lacertae object. Astronomy & Astrophysics, 529, A49.
- H.E.S.S. Collaboration, Abdalla, H., et al. (2018). The H.E.S.S. Galactic plane survey. Astronomy & Astrophysics, 612, A1.
- H.E.S.S. Collaboration, Abdalla, H., et al. (2018a). H.E.S.S. observations of RX J1713.7−3946 with improved angular and spectral resolution: Evidence for gamma-ray emission extending beyond the X-ray emitting shell. Astronomy & Astrophysics, 612, A6.
- Lemoine-Goumard, M., Grondin, M.-H., et al. (2014). HESS J1640−465 and HESS J1641−463: Two intriguing TeV sources in the light of new Fermi-LAT observations. The Astrophysical Journal Letters, 794(1), L16.