Observation & instruments · UNIR
Introduction to the Virtual Observatory: Aladin, TOPCAT and VOSA
Three exercises with Virtual Observatory tools: a multispectral mosaic of the Antennae galaxies from X-rays to the submillimetre, the identification of a brown dwarf by cross-matching catalogues, and the SED fit of HD 302505 with and without interstellar extinction.

1. A 3×3 multispectral mosaic of a galaxy in Aladin
In this exercise, a mosaic of the galaxy NGC 4038/4039 (the Antennae) was built in Aladin with images from different surveys covering a wide range of the electromagnetic spectrum, from X-rays to the far infrared. Each image was chosen for its quality and representativeness, giving priority to resolution and to the ability to highlight different physical processes in the galaxy. The final mosaic makes it possible to compare how the appearance of the galaxy changes with wavelength and gives a comprehensive view of its structure and components.
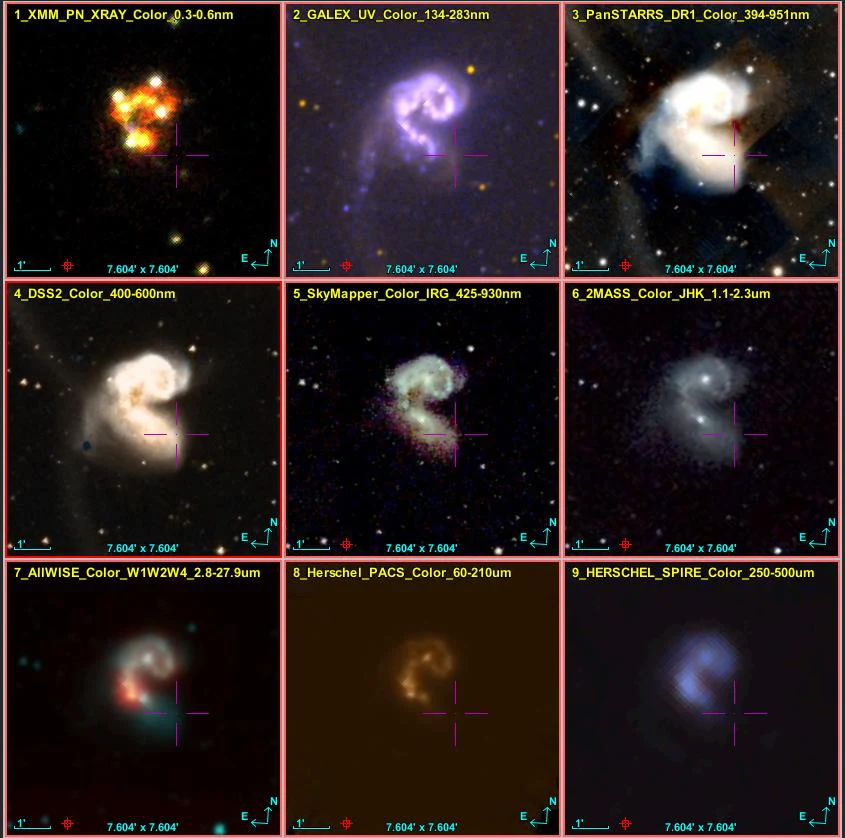
| ID | Survey | Wavelength | Spectral range |
|---|---|---|---|
| 1 | XMM-Newton — X-ray false-colour images | X-rays | 0.3–0.6 nm |
| 2 | GALEX GR6/7 — UV colour composite | Ultraviolet | 134–283 nm |
| 3 | Pan-STARRS DR1 — colour (z-g-g) | Optical | 394–951 nm |
| 4 | DSS2 — colour | Optical | 400–600 nm |
| 5 | SkyMapper DR4 — IRG colour | Optical (up to the NIR) | 425–930 nm |
| 6 | 2MASS — JHK colour | Near infrared | 1.15–2.30 µm |
| 7 | AllWISE — W1/W2/W4 colour | Mid infrared | 2.8–27.9 µm |
| 8 | Herschel PACS — colour | Far infrared | 60–210 µm |
| 9 | Herschel SPIRE — colour | Submillimetre | 250–500 µm |
Table 1. Surveys used in the mosaic.
- XMM-Newton (false colour, 0.3–0.6 nm). The red channel corresponds to the lowest-energy photons of the range, green to intermediate energies and blue to the most energetic. This composite highlights structures associated with hot gas, shocks and highly ionised regions. It is ideal for observing the most energetic emission of the system, invisible to any optical telescope.
- GALEX GR6/7 (UV, 134–283 nm). Ultraviolet image composed from the far ultraviolet (FUV), in the blue channel, and the near ultraviolet (NUV), in the red. It highlights regions of recent star formation and is ideal for studying young populations and active processes in galaxies.
- Pan-STARRS DR1 (z-g-g colour, 394–951 nm). Colour image obtained from the g and z bands of the Pan-STARRS1 survey, which covers the optical between about 394 and 951 nm. It is one of the most complete views of the “visible” appearance of the galaxy. The survey was carried out with the 1.8 m PS1 telescope in Hawaii and a 1.4-gigapixel camera.
- DSS2 (colour, 400–600 nm). Optical colour image generated by the CDS from the photographic plates of the DSS2 survey, combining the blue channel (≈ 400 nm), the red (≈ 600 nm) and a synthetic green channel obtained as the average of both. Although it is an older survey, its coverage is excellent and it offers a classic view of the galaxy in visible light.
- SkyMapper DR4 (IRG colour, 425–930 nm). Colour composite from the I, R and G bands of the SkyMapper Shallow Survey. Assigning I to red, R to green and G to blue emphasises differences in temperature and stellar population within the galaxies. DR4, SkyMapper’s fourth and final data release (Onken et al., 2024), gathers observations from 2014 to 2021.
- 2MASS (JHK colour, 1.1–2.3 µm). The 2MASS survey covers the whole sky in the infrared J, H and K bands, observed with two 1.3 m telescopes in Arizona and Chile. The composite assigns K to red, H to green and J to blue, and highlights cold structures, interstellar dust and regions where the optical extinction is high. This catalogue made it possible to build the most uniform and deepest infrared map of the whole sky available.
- AllWISE (W1/W2/W4 colour, 2.75–27.9 µm). AllWISE combines the infrared data from WISE. The composite assigns W4 (22 µm) to the red channel, W2 (4.6 µm) to green and W1 (3.4 µm) to blue, and highlights the thermal emission of warm dust and mid-infrared structures. It makes it possible to identify active regions, nebulosity and cool sources invisible in the optical.
- Herschel PACS (colour, 60–210 µm). Composite from the public observations of the PACS instrument on the Herschel space telescope, which operates in the far infrared. It assigns 70 µm to the blue channel and 160 µm to red, and reveals the thermal emission of cold dust in star-forming regions, structures that are seen neither in the optical nor in the near infrared.
- Herschel SPIRE (colour, 250–500 µm). Composite from all the public observations of Herschel’s SPIRE instrument. It assigns 250 µm to the blue channel, 350 µm to green and 500 µm to red, and traces the thermal emission of the coldest dust in the galaxy. At these wavelengths, regions of gas and dust at tens of kelvin dominate, revealing the densest and coldest zones of the interstellar medium of NGC 4038/4039.
It was decided to include three surveys in the optical range (Pan-STARRS, DSS2 and SkyMapper) because, although they cover a similar wavelength range, each one provides different and complementary information on the morphology of the galaxy. The optical is where the detailed structure is best seen: star-forming regions, spiral arms, dust lanes and colour differences associated with the stellar populations. However, no single optical survey captures everything with the same quality, whether because of resolution, depth, filters or observing conditions:
- Pan-STARRS provides the deepest image with the best resolution in this range.
- DSS2 offers a more classic and balanced view of the mid-optical, useful as an intermediate reference.
- SkyMapper covers broad filters that highlight specific regions and help to compare real colour variations in the galaxy.
Using all three gives a more complete view of the optical range, showing differences that a single survey might miss. This enriches the mosaic and improves the physical interpretation when all the images across the spectrum are compared.
2. Identifying a brown dwarf by cross-matching catalogues with TOPCAT
The 2MASS-PSC (near infrared) and SDSS-DR12 (optical) catalogues of the same region of the sky were downloaded and cross-matched with a radius of 4 arcseconds, so that only the sources that truly coincide in position remained. After the cross-match, filters were applied in stages to narrow down the search:
- Point-like SDSS objects were selected (
class = 6). - Only objects that do not appear in the SDSS u and g optical filters (u > 22 and g > 22.2) were kept. Brown dwarfs are very faint in these bands, so this condition helps to rule out normal stars and keep the real candidates.
- Finally, the infrared colours characteristic of a T-type brown dwarf were applied: J − H < 0.3 and H − K < 0.3.
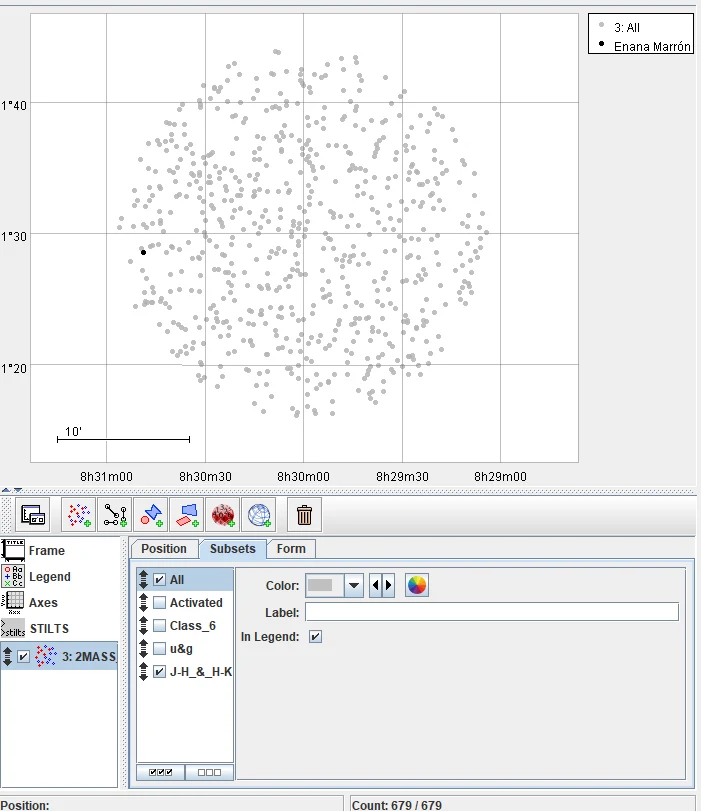
Combining these criteria left a single candidate that meets all the conditions. Its blue infrared colours (J − H and H − K < 0.3), caused by methane absorption, are typical of the coolest brown dwarfs, of type T, so it is a T-dwarf candidate in the region analysed. Figure 2 shows the final result of the filtering and the position of the selected candidate.
3. VOSA: building and fitting the SED of HD 302505 with and without interstellar extinction
For this exercise, the spectral energy distribution (SED) of the star HD 302505 was built in VOSA, with photometry from the UBV, Tycho, Strömgren, DENIS, 2MASS and WISE catalogues.
First, a χ² fit was carried out without extinction, with Kurucz ODFNEW/NOVER (2003) atmosphere models. The process was then repeated allowing VOSA to explore extinction values in the range AV = 0–3, with a new SED fit that takes the effect of interstellar dust into account.
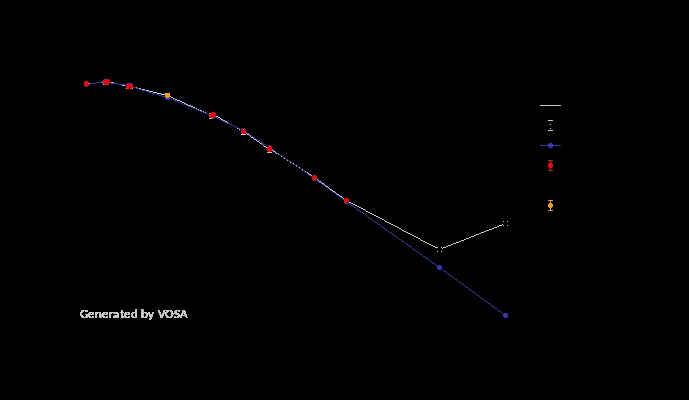
In the fit without extinction (Figure 3), VOSA tried to fit the data without considering interstellar dust (AV = 0 mag), and the only mathematical way it found to make the curve match the slope of the data was to “cool” the star. It thus turned a B2 star, of about 20,000–22,000 K according to the usual calibrations (Pecaut and Mamajek, 2013; the exercise statement gave about 30,000 K), into an F-type star, somewhat hotter than the Sun, at 6500 K.
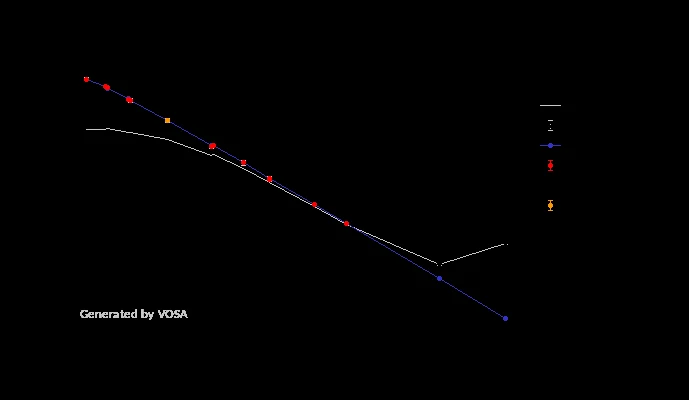
However, when VOSA was allowed to fit the extinction in the range 0 to 3, the result changes drastically (Figure 4): VOSA detects a lot of dust, AV = 2.25 mag. Once this is corrected, the fit comes much closer to the real temperature of the star, ~26,000 K, typical of an early B star (B0.5–B1 in the usual calibrations, somewhat hotter than a B2) and far from the 6500 K of the first fit.
This analysis shows that the blue light of the star is being heavily absorbed by the interstellar medium, and it confirms that the apparent “coolness” of the first fit was solely the product of interstellar reddening.
References
- Onken, C. A., Wolf, C., Bessell, M. S., et al. (2024). SkyMapper Southern Survey: Data Release 4. Publications of the Astronomical Society of Australia, 41, e061.
- Pecaut, M. J., & Mamajek, E. E. (2013). Intrinsic colors, temperatures, and bolometric corrections of pre-main-sequence stars. The Astrophysical Journal Supplement Series, 208(1), 9.