Stellar astrophysics · UNIR
Spectral analysis and classification with the SPLAT-VO tool
Classification of three stars from their optical spectra: estimate of the effective temperature with Wien’s law, continuum normalisation and comparison of diagnostic lines with Gray’s atlas to determine spectral type and luminosity class.

Introduction
In this work, three stars are classified from their optical spectra, connecting observable features with physical properties. First, an initial estimate of the effective temperature is obtained from the shape of the continuum and the observed maximum, to place each spectrum in the OBA, FG or KM groups. Each spectrum is then prepared by normalising the continuum: for hot or warm stars the continuum is fitted with polynomials, and for cool stars a global fit is adopted so as not to distort the molecular bands. With the spectra now comparable, the diagnostic lines are identified and compared with Gray’s atlas to determine the spectral type and the luminosity class.
1. Effective temperature and approximate spectral type
The three stellar spectra were plotted together (Figure 1) to compare the shape of their continua visually. Since the energy distribution of a star can be approximated, in the first instance, by that of a black body, the relative position of the emission maximum and the overall slope of the continuum allow a qualitative estimate of the effective temperature and, consequently, of the spectral type.
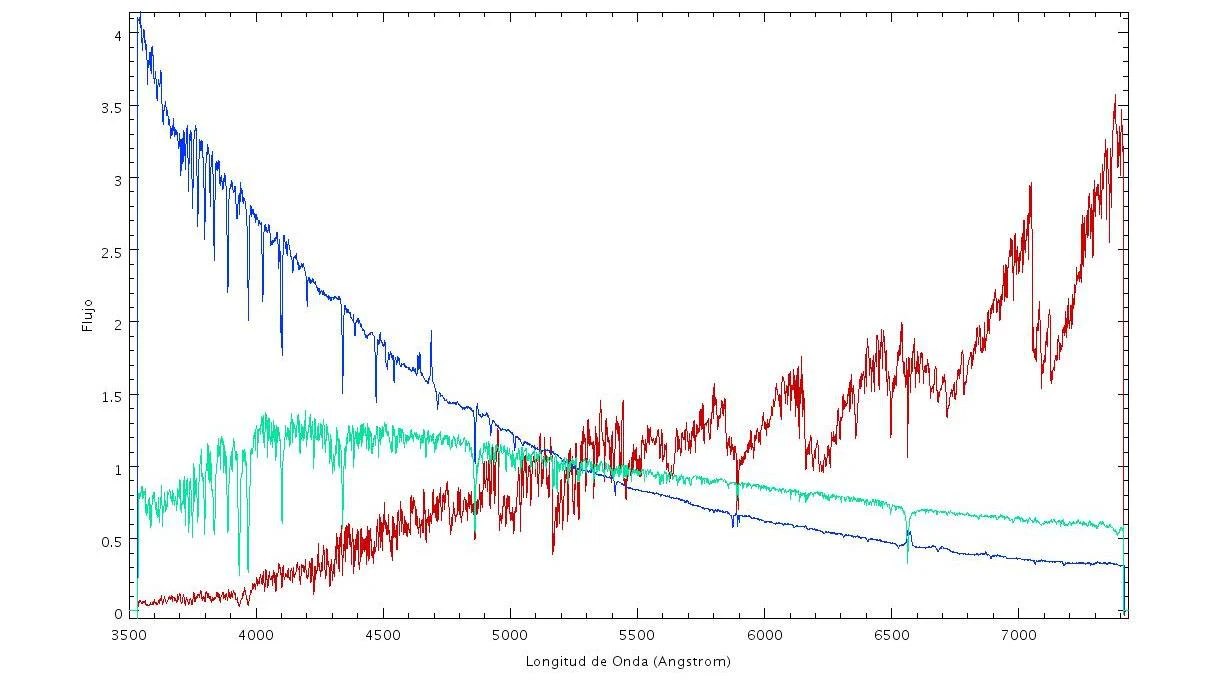
To estimate the effective temperature of each star approximately, Wien’s displacement law, valid for a black body, is used: λmax · T = b, where λmax is the wavelength of the emission maximum, T the effective temperature and b Wien’s constant, b ≈ 2.8978 × 10⁶ nm·K (Carroll and Ostlie, 2017). Then:
Teff ≈ b / λmax (Equation 1)
Star 1. The spectrum of star 1 (red) has a continuum that clearly rises towards long wavelengths, with an observed maximum around 7378.1 Å (≈ 737.81 nm) and higher relative intensity in the red part of the visible spectrum. This behaviour is characteristic of cool stars, whose emission maximum is shifted towards the red or the infrared. Applying Equation 1:
Teff ≈ 2.897771955 × 10⁶ nm·K / 737.81 nm ≈ 3.93 × 10³ K (~3900 K)
Star 1 can therefore be classified within the KM group, corresponding to stars of low effective temperature.
Star 2. The spectrum of star 2 (blue) shows a continuum steeply tilted towards short wavelengths, with an observed maximum around 3535.1 Å (≈ 353.51 nm), at the boundary between the near ultraviolet and the visible. This distribution indicates a star of high effective temperature, emitting mostly in the blue and ultraviolet:
Teff ≈ 2.897771955 × 10⁶ nm·K / 353.51 nm ≈ 8.20 × 10³ K (~8200 K)
Consequently, star 2 is classified within the OBA group, compatible with an A-type star according to the estimated temperature, without ruling out hotter types given the limited spectral range.
Star 3. The spectrum of star 3 (green) has a relatively flatter continuum in the visible, with an observed maximum close to 4039.1 Å (≈ 403.91 nm). Although it does not reach the extreme temperatures of star 2, its emission is still dominated by short wavelengths, indicating an intermediate-to-high temperature. On the basis of this distribution it would be classified in the FG group, without ruling out an early A-type star. Applying Equation 1:
Teff ≈ 2.897771955 × 10⁶ nm·K / 403.91 nm ≈ 7.18 × 10³ K (~7200 K)
This calculation confirms the classification of star 3 within the FG group, more compatible with an F-type star.
One point that should not be left out is that the spectra are limited to the visible range. In very hot stars the true maximum may lie at shorter wavelengths (ultraviolet), so the effective temperatures calculated should be interpreted as approximations based on the observed maximum, useful mainly for comparing in relative terms which star is cooler or hotter.
| Star | λ of observed maximum (Å) | λ of observed maximum (nm) | Approximate classification | Estimated Teff (K) |
|---|---|---|---|---|
| Star 1 (red) | 7378.1 | 737.81 | KM | ~3900 |
| Star 2 (blue) | 3535.1 | 353.51 | OBA | ~8200 |
| Star 3 (green) | 4039.1 | 403.91 | FG | ~7200 |
Table 1. Summary of the estimated spectral properties of the stars analysed.
2. Normalisation of the spectra
At this point each spectrum is normalised individually to isolate the spectral lines from the overall behaviour of the continuum. Since the shape of the continuum depends strongly on the effective temperature, different methods were applied depending on the type of star. For the hot or warm stars, whose continuum varies smoothly with wavelength, a polynomial fit was used. For the cool star, dominated by broad molecular bands, a global freehand fit was used, better suited to describing its real continuum without overfitting.
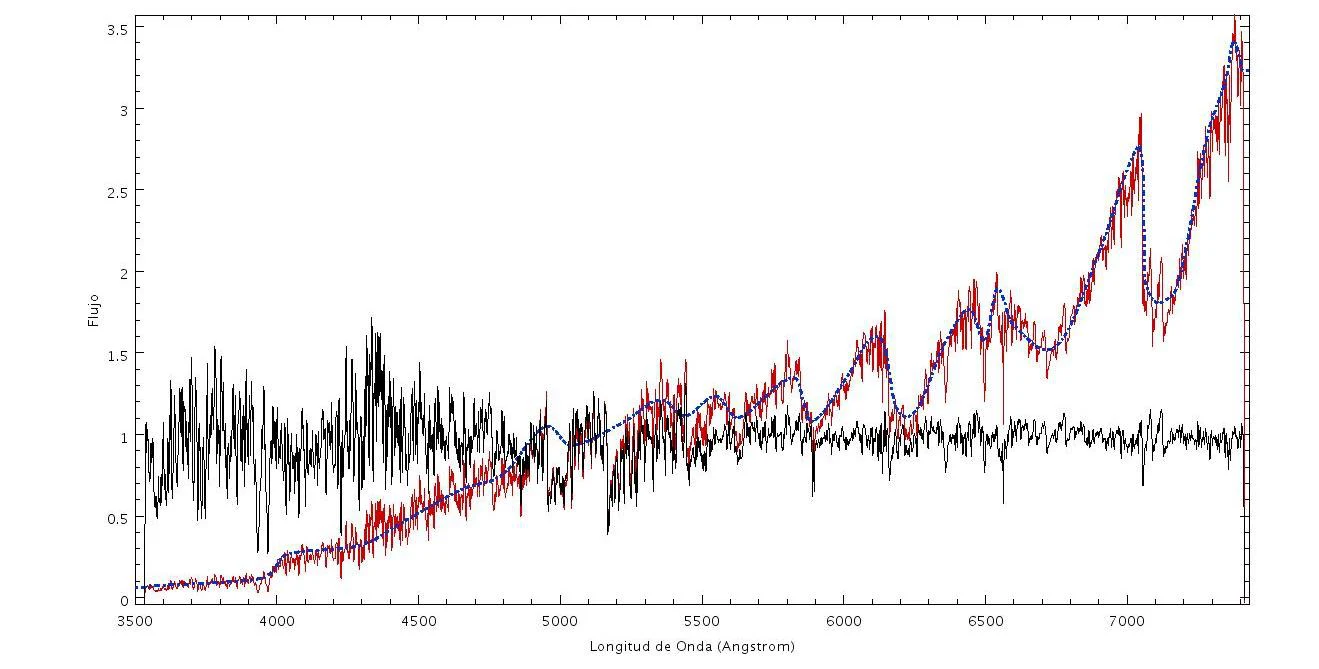
Star 1. For star 1, classified as cool, the continuum was estimated with a global freehand fit, interpreted as a pseudo-continuum. In cool stars, the atmospheric temperature allows stable molecules to form (such as TiO, VO or CaH), whose electronic and vibrational transitions produce broad absorption bands that affect large regions of the visible spectrum. As a result, the true continuum is partly hidden and what can be observed is an upper envelope modulated by molecular absorption (Gray, 2005; Kirkpatrick et al., 1991).
Following the treatment recommended in the literature for this type of star, a smooth, conservative fit was chosen, avoiding an excessively detailed curve that might adapt itself to real physical spectral structures. Overly detailed fits can artificially reduce the depth of the molecular bands and alter the information associated with the temperature and atmospheric composition, so they are not advisable when the aim is a global spectral analysis (Gray, 2005; Allard et al., 2000). For this reason, although several manual fits were explored, the global fit (Figure 2) was finally adopted, as it best represents the observed pseudo-continuum without removing or distorting the molecular bands characteristic of cool stars. The normalisation was done by dividing the observed spectrum by this pseudo-continuum, which gives a spectrum with an approximately constant baseline, suitable for the later analysis of lines and bands without the bias of the overall flux slope.
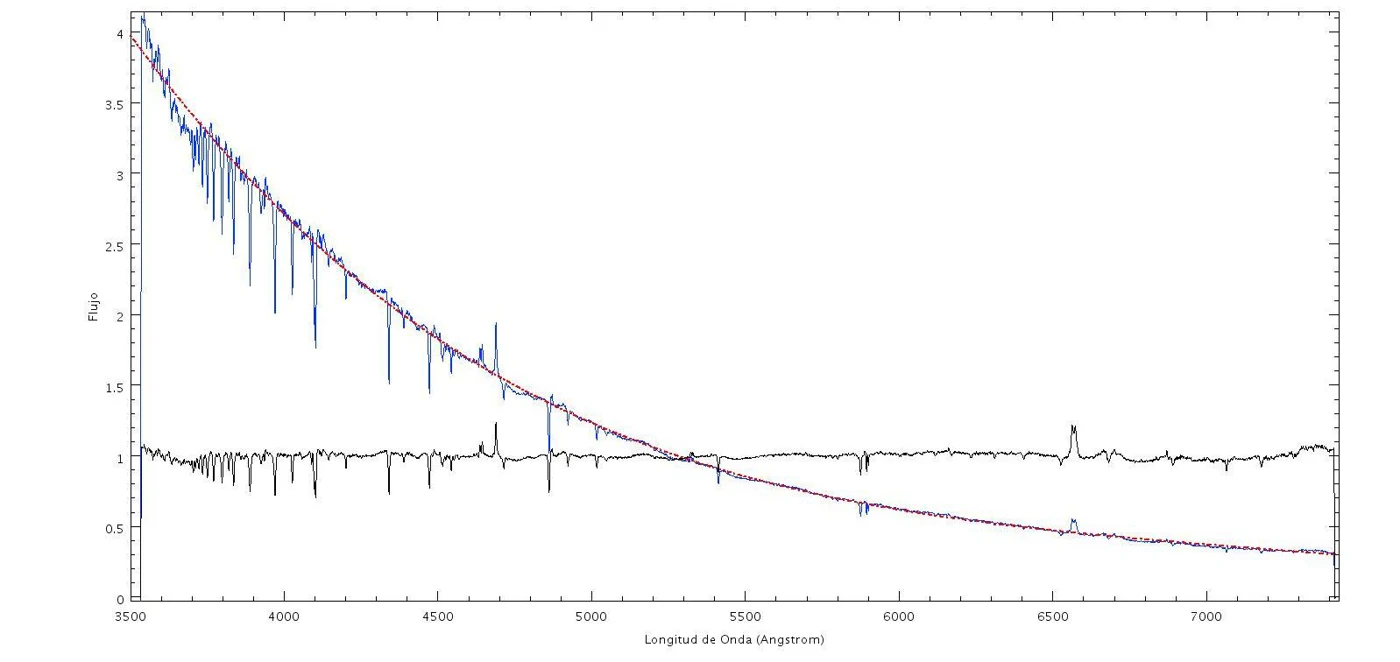
Star 2. For star 2, a continuum fit with polynomials of degree 5–6 was tried first, but those degrees proved too “flexible”: the curve began to follow fine details of the spectrum (lines and noise) instead of only the smooth trend of the continuum. A polynomial of degree 4 was therefore adopted, which describes the global curvature well without introducing artificial ripples.
To build the fit, wavelength ranges without strong lines were chosen, avoiding in particular the Balmer series: a set of hydrogen absorption lines in the visible, typical of hot stars, which appear as pronounced “valleys” and must not be mistaken for the continuum level.
Finally, the normalisation was done by dividing the observed spectrum by the fitted continuum, which gives a spectrum with an approximately constant baseline close to 1 (Figure 3). This allows the absorption lines to be compared and measured without the slope of the continuum, which is related to temperature, biasing the analysis.
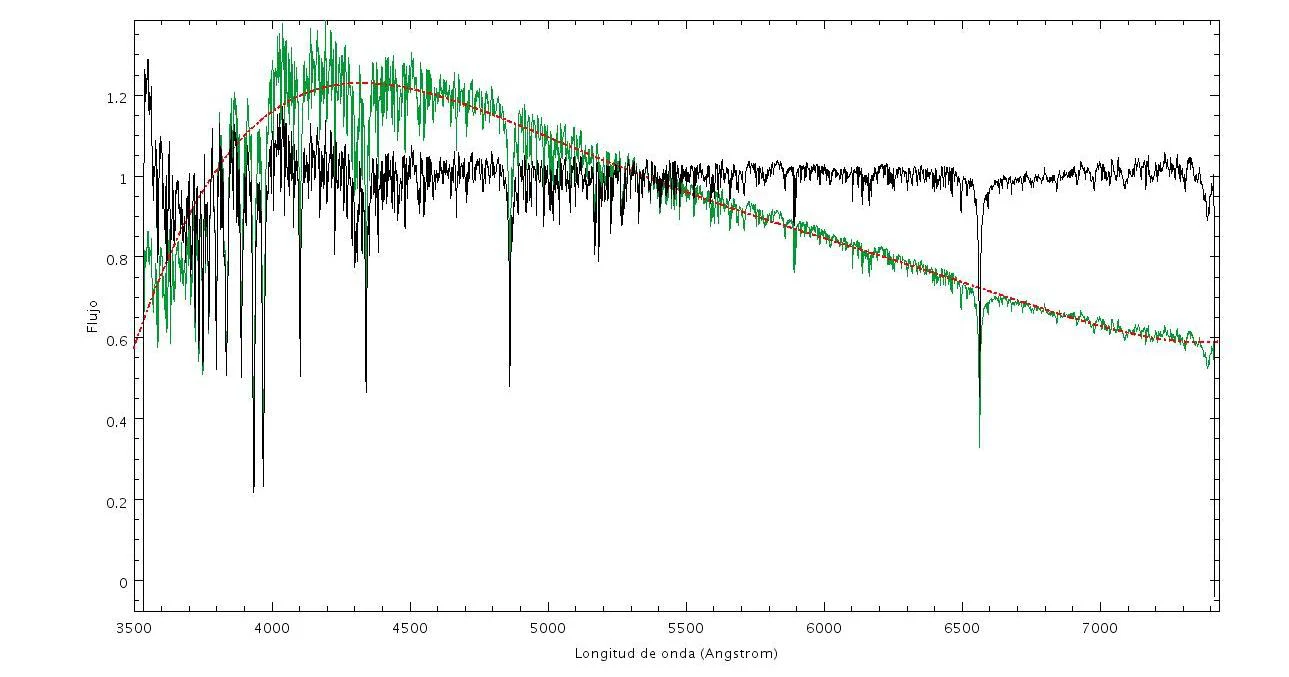
Star 3. For star 3, the same normalisation procedure with a polynomial fit was applied. In this case, polynomials of degrees 4, 5, 6 and 7 were explored to assess how sensitive the result is to the degree of the polynomial, and all of them were found to reproduce the global shape of the continuum in a similar way. Following a conservative criterion, a polynomial of degree 5 was adopted, which describes the curvature of the continuum without overfitting or artificial oscillations. The normalisation, dividing the observed spectrum by the fitted continuum, gives a spectrum with an approximately constant baseline around unity (Figure 4), which allows the spectral lines to be analysed and compared independently of the overall energy gradient imposed by the temperature.
3. Final classification from spectral lines
The final classification was made by comparing the spectrum of each star with the reference spectral catalogues of Gray and Corbally, collected in Gray’s digital atlas of spectral classification (Gray, n.d.).
Star 1
According to the preliminary classification, star 1 belongs to the group of cool KM-type stars. Following the instructions of the exercise, the comparison was made with the original, non-normalised spectrum (Figure 5).
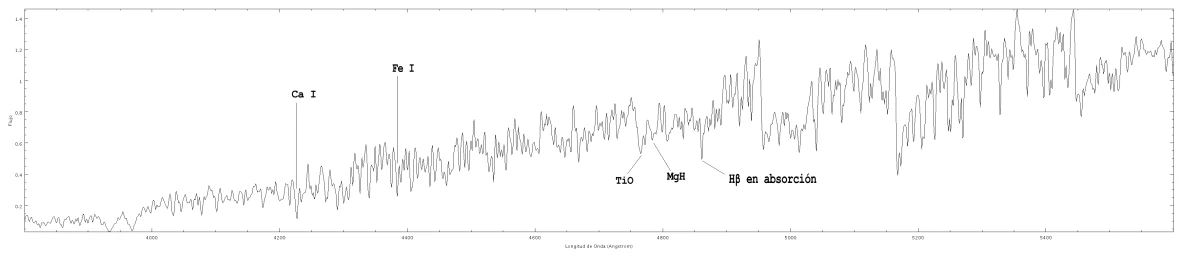
Comparison with the catalogue Main Sequence K5–M4.5. This catalogue presents spectra of main-sequence stars with unrectified flux and is designed to assign the spectral type (subtype) by comparing features that change with temperature among dwarfs (class V), which allows both the lines and the shape of the continuum to be analysed (Gray and Corbally, 2009). The following features were analysed:
- Fe I 4383 Å. In the spectrum of star 1, an absorption line around 4383 Å is clearly identified, matching in position and depth the one observed in the late K-type stars of the catalogue.
- Ca I 4227 Å. Comparing its depth visually with that of Fe I 4383 Å, the Ca I line is slightly deeper, which reproduces the pattern of the spectrum of a K7 V star in the catalogue.
- MgH 4780 Å / TiO 4763 Å region. Between 4770 and 4790 Å there is an overlap of MgH and TiO. Its morphology is compatible with the spectra of late K-type stars in the catalogue, although no structure is marked enough to allow a unique assignment within the K–M sequence.
- Hβ 4861 Å. In star 1, Hβ appears in absorption, which rules out a direct match with the latest spectra in the catalogue (for example, M4.5 Ve), in which Hβ appears in emission.
These features are typical of cool atmospheres, in which low ionisation favours the lines of neutral metals and the formation of stable molecules. The relative depth of Ca I and Fe I responds both to temperature and to atmospheric pressure, which depends on surface gravity. From this comparison, the spectrum of star 1 is compatible with a K7 V star.
Comparison with the catalogue Luminosity Effects at M2. As a complement, the spectrum was compared with this catalogue, whose aim is to analyse the sensitivity of certain lines to the luminosity class in cool stars (Gray and Corbally, 2009). It is not meant for finding the type from scratch but for estimating the luminosity class (I, III or V), assuming that the star is roughly M2 and examining luminosity-sensitive indicators:
- Ca I 4227 Å. The catalogue points out that this line has a negative luminosity effect in M2 stars and is one of the most sensitive to the luminosity class. The depth observed in star 1 is comparable to that of the spectrum classified as M2 Ib.
- MgH/TiO region around 4770 Å. The morphology of the MgH–TiO overlap in star 1 looks more like that of the M2 Ib spectrum than that of a dwarf, not only because of the absence of a pronounced “tooth” but also because of the global shape of the continuum in this region.
- Hβ 4861 Å. In this catalogue, Hβ appears in absorption in Ib supergiants and in emission in some other cases. Since it is observed in absorption in star 1, this feature is consistent with an M2 Ib classification.
From the point of view of luminosity effects, star 1 therefore shows a good match with an M2 Ib star. The catalogue indicates that the Ca I 4227 Å line and the morphology of the MgH/TiO overlap are sensitive to the luminosity class, which is interpreted physically as a consequence of changes in surface gravity, which modify the atmospheric pressure and, with it, the formation and profile of the metallic lines and molecular bands (Gray, 2005; Gray and Corbally, 2009).
Final classification of star 1. The comparison with the catalogue Main Sequence K5–M4.5 indicates that star 1 is compatible with a late K star, in particular K7, on the main sequence. On the other hand, when the luminosity indicators are analysed with the catalogue Luminosity Effects at M2, and under the hypothesis of a type close to early M, the observed features are consistent with a high luminosity class (Ib). However, the luminosity-effects catalogue is calibrated for an M2 type and the star turns out to be K7, so its indicators are not conclusive in this case. The classification K7 V, given by the main-sequence catalogue, is therefore adopted, with the caveat that the luminosity indicators available in this spectral range cannot confirm it independently.
Star 2
In section 1, star 2 was classified within the OBA group, so the detailed analysis was carried out with the normalised spectrum. The final classification was made by comparing sections of the observed spectrum directly with Gray’s atlases, adjusting the wavelength range in each case to that of the reference catalogue.
Comparison with the catalogue Main Sequence O9–B5. To determine the spectral type, this catalogue by Gray and Corbally was used, which covers the range between 3800 and 4600 Å. The normalised spectrum of star 2 was therefore cut to that interval (Figure 6).

In this range, the following features are clearly identified:
- He I 4009–4026 Å doublet. The doublet is present: specifically, the He I 4026 Å line has a depth comparable to that of the O9 V stars in the catalogue, while its “partner”, He I 4009 Å, is not as deep, unlike B-type stars, in which this line is easily detected because of its depth.
- He II 4200 Å. This line is present and well marked, in agreement with O-type stars and in contrast with B-type stars, in which it does not appear.
- He I 4471 Å. It is seen as a strong, dominant line, without a comparable contribution from Mg II 4481 Å, which reinforces the assignment to an early O type on the main sequence.
According to the explicit criteria of the catalogue, the simultaneous presence of strong He I lines and well-defined He II lines is consistent with an O9 V star.
Comparison with the catalogue Luminosity Effects at O7. To determine the luminosity class, this catalogue by Gray and Corbally was used, which analyses the sensitivity of certain lines to luminosity in O-type stars. The normalised spectrum of star 2 was cut between 4500 and 5100 Å (Figure 7), the same range as the atlas.

In this interval, the following were analysed in particular:
- N III 4634–4642 Å doublet. In star 2 this doublet stands out clearly, with a morphology that matches that of the O7 If stars in the catalogue.
- He II 4686 Å. The direct comparison with the atlas shows a better match with the spectrum of a supergiant than with that of a main-sequence star, especially because of the behaviour of the N III complex and the He II 4686 Å line, which is not seen in emission in the catalogue samples but appears clearly as an emission line in this star.
According to the catalogue, the presence of the N III doublet in emission is a characteristic indicator of high-luminosity O stars.
Final classification of star 2. From the joint analysis of the spectral type and the luminosity indicators, it is concluded that star 2 is an O9 If star, that is, an early O star with a supergiant luminosity class.
Star 3
According to the preliminary classification, star 3 belongs to the FG group, with Teff ≈ 7200 K. The analysis was carried out with the normalised spectrum cut between 3800 and 4600 Å, to match the range of the catalogues used and allow a more direct comparison of the depth and morphology of the lines.
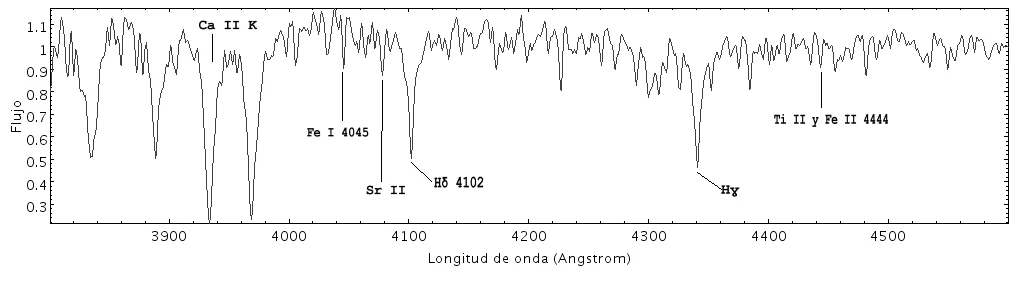
Comparison with the catalogue Main Sequence A5–G0. This catalogue presents spectra of main-sequence stars from A5 to G0 and allows the evolution of the strength of the hydrogen lines, the progressive strengthening of the metallic lines and the appearance of molecular bands in the coolest stars to be analysed (Gray and Corbally, 2009). According to its description, from late A types onwards the hydrogen lines begin to weaken, while the metallic lines become markedly stronger towards types F and G. The following features were taken into account:
- Fe I 4045 Å – Hδ 4102 Å ratio. In star 3, the Fe I 4045 Å line has a depth comparable to that of the F5 V spectra in the catalogue, while Hδ 4102 Å appears clearly in absorption, with a strength consistent with intermediate F-type stars.
- Broadening of Hγ 4341 Å. The morphology and width of Hγ match the F5 V spectra in the catalogue: narrower than in early A stars and more marked than in G stars.
From this comparison, the spectrum of star 3 is compatible with an F5 V star.
Comparison with the catalogue Luminosity Effects at F5. As a complement, the spectrum was compared with this catalogue, whose aim is to analyse the sensitivity of certain lines to the luminosity class in F-type stars (Gray and Corbally, 2009). The catalogue indicates that, from F5 onwards, the hydrogen lines lose sensitivity to luminosity, so the classification must be based mainly on lines and combinations of ionised species, in particular the Sr II 4077 Å line and certain metallic complexes. The following were analysed:
- Sr II 4077 Å – Hδ 4102 Å ratio. In star 3 the Sr II 4077 Å line is clearly identified, and its depth relative to Hδ is compatible with the F5 III–IV spectra in the catalogue.
- Ti II – Fe II 4444 Å complex. Its morphology is consistent with the F5 III–IV spectra. Although it could also be compatible with an F5 V, the catalogue indicates that, from F5 onwards, the Sr II 4077 Å line is a more reliable luminosity indicator.
- Ca II K line. The catalogue points out that in F5 and later stars this line has a positive sensitivity to luminosity and broadens slightly in the more luminous stars. In star 3 a moderate broadening is observed, consistent with a classification intermediate between dwarfs and giants.
Taking this evidence together, the spectral behaviour of star 3 is most consistent with a luminosity class of III–IV.
Final classification of star 3. From the joint analysis of the spectral type and the luminosity indicators, it is concluded that star 3 is an F5 III–IV star, that is, an intermediate F star with a luminosity class compatible with a subgiant or an early giant.
| Star | Preliminary classification | Final classification |
|---|---|---|
| Star 1 | KM, ~3900 K | K7 V |
| Star 2 | OBA, ~8200 K | O9 If |
| Star 3 | FG, ~7200 K | F5 III–IV |
Table 2. Summary of the classification of the three stars.
Conclusion
The analysis of the three spectra made it possible to link observable properties directly with stellar physics. The shape of the continuum gave a first estimate of the effective temperature, which placed each star in the OBA, FG and KM groups and guided the later comparison with the appropriate spectral atlases.
Normalising the continuum proved a key step: by removing the global variation of the flux, the spectral lines could be compared correctly. For the hot and warm stars moderate polynomial fits were used, while for the cool star a global fit was used to preserve the broad molecular bands characteristic of this type of object.
Finally, the comparison with Gray’s catalogues made it possible to assign, with reasoned arguments, the spectral type and luminosity class of each star. The exercise showed that stellar classification is not mechanical: it requires justified methodological decisions and a careful physical interpretation of the spectral features, always bearing in mind the observational limitations of the available data.
References
- Allard, F., Hauschildt, P. H., & Schweitzer, A. (2000). The NextGen model atmospheres: Cool stars and substellar objects. The Astrophysical Journal, 539(1), 366–372.
- Carroll, B. W., & Ostlie, D. A. (2017). An Introduction to Modern Astrophysics (2nd ed.). Cambridge University Press.
- Gray, D. F. (2005). The Observation and Analysis of Stellar Photospheres (3rd ed.). Cambridge University Press.
- Gray, R. O., & Corbally, C. J. (2009). Stellar Spectral Classification. Princeton University Press.
- Gray, R. O. (n.d.). Stellar Spectral Classification (Digital Atlas). NED/IPAC, Caltech.
- Kirkpatrick, J. D., Henry, T. J., & McCarthy, D. W., Jr. (1991). A standard stellar spectral sequence in the red/near-infrared: Classes K5 to M9. The Astrophysical Journal Supplement Series, 77, 417–440.