High energies · UNIR
Analysis of anisotropies in ultra-high-energy cosmic rays
Reproduction of the analysis of Aab et al. (2017) with open data from the Pierre Auger Observatory: SD and FD energies, angular distributions, arrival and exposure maps with HEALPix, and a Rayleigh analysis in right ascension for the events above 8 EeV.

Introduction
Ultra-high-energy cosmic rays (UHECR, with energies above 10¹⁸ eV) are the most energetic projectiles observed in nature, but their origin remains a mystery. The difficulty is that, being charged particles, the magnetic fields of our galaxy and of the intergalactic medium deflect their paths and erase the straight line that would point directly to the source.
Aab et al. (2017) ask a specific question: despite those deflections, is the distribution of the arrival directions of cosmic rays above 8 EeV (1 EeV ≡ 10¹⁸ eV) isotropic, or does it show a large-scale anisotropy? The paper’s answer is unequivocal: there is a dipolar anisotropy (a gentle excess of events towards one side of the sky and a deficit towards the opposite side) with a statistical significance above 5.2σ. Its direction points about 125° away from the Galactic centre, which rules out a purely Galactic origin and points to an extragalactic origin.
Here the analysis is reproduced on a subset of the Pierre Auger Observatory data used in the paper, provided for this activity and publicly available through Pierre Auger Open Data.
Energies: fluorescence (FD) versus surface (SD)
The Pierre Auger Observatory (Malargüe, Argentina, latitude −35.2°) is a hybrid system with two complementary detection techniques (The Pierre Auger Collaboration, 2015):
- Surface detectors (SD): 1600 water tanks spread over 3000 km² that record, through Cherenkov light, the particles of the air shower when they reach the ground. They operate almost 100 % of the time, day and night.
- Fluorescence telescopes (FD): they observe the faint ultraviolet light emitted by the showers as they excite the nitrogen in the air. This measurement is almost calorimetric, because it measures the deposited energy almost directly, with little model dependence, but it can only be made on clear, moonless nights, about 15 % of the time.
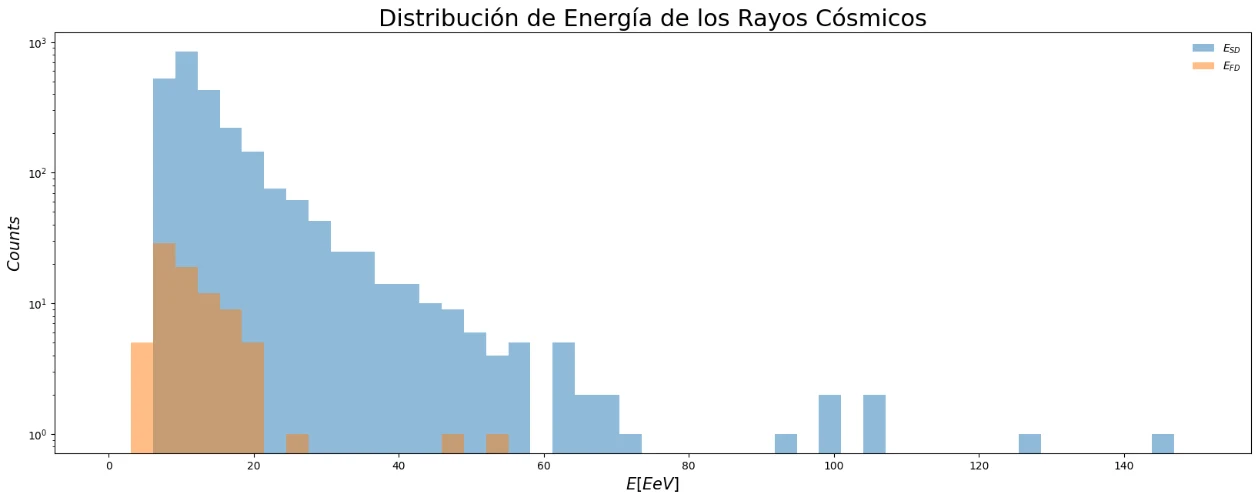
These differences explain what is seen in Figure 1:
- The SD records far more events than the FD. The data contain 2465 events with ESD > 8 EeV compared with only 82 with a usable FD measurement, because of the different duty cycle (100 % versus 15 %).
- The SD spectrum extends up to about 150 EeV and falls very steeply (the more energetic the events, the rarer they are), while the few FD energies are concentrated in the lower-energy region.
- FD and SD are two independent estimators of the same shower. The SD energy (derived from the signal at 1000 m from the axis) is calibrated with hybrid events seen by the FD. That is why, for the same event, the two energies differ within the 16 % uncertainty, and some events with ESD > 8 EeV have EFD below 8 EeV.
Angular distributions: zenith and azimuth angles
Figure 2 shows the two angular distributions, which have very different shapes: that of the zenith angle θ and that of the azimuth angle φ.
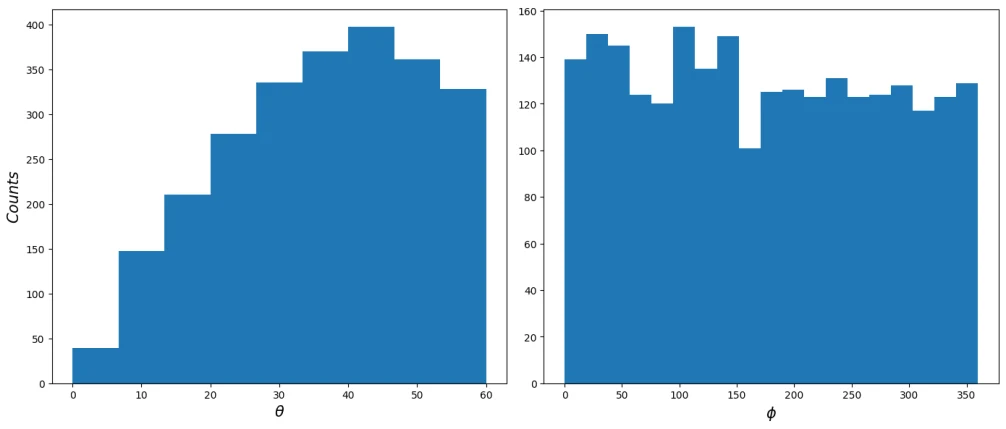
The zenith angle θ (measured from the vertical) rises from almost zero to a maximum around 40–45° and then decays, with a clean cut at 60°. The shape is purely geometric: for an isotropic flux, the number of events per zenith-angle interval is proportional to sin θ · cos θ. The sin θ factor comes from the solid angle (there is “more sky” available at large angles); the cos θ factor, from the projected area of the detector (a flat detector “sees” less effective surface the more inclined the shower arrives). The product sin θ · cos θ = ½ sin(2θ) peaks at θ = 45°, exactly where the distribution has its maximum; the cut at 60° removes the very inclined events, which are reconstructed with a different method.
The azimuth angle φ (the orientation in the horizontal plane, like a compass needle) is, by contrast, roughly flat. The reason is symmetry: the detector has no privileged horizontal direction, so all orientations are equivalent and receive, on average, the same number of events. The small fluctuations are statistical, with slight deviations due to the geomagnetic field and a slight slope of the ground. In short, θ has structure because it combines the geometry of the sky and that of the detector, while φ is flat by symmetry.
Arrival-direction and exposure maps
Of the subset provided (24,319 events, 22,751 with energy reconstructed by the surface detector), only 2465 exceed 8 EeV: these are the ones used in the arrival-direction analysis.
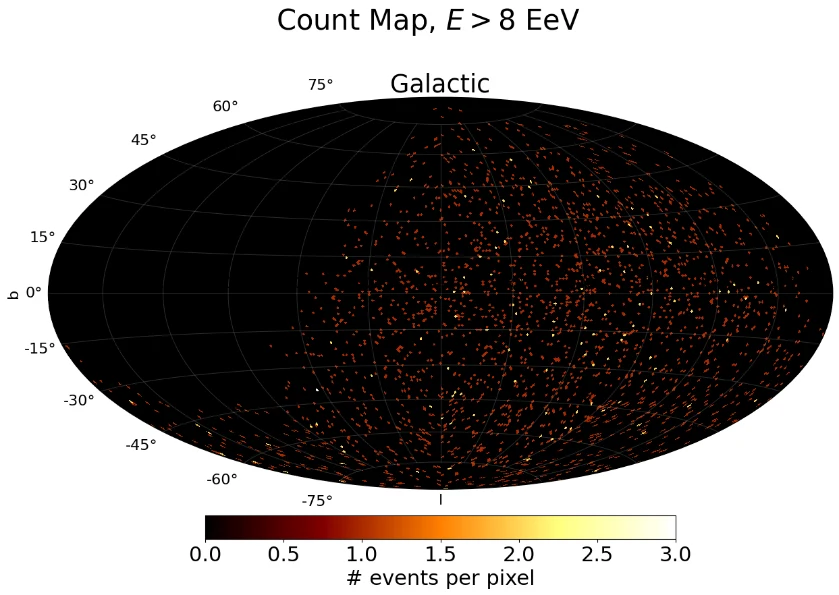
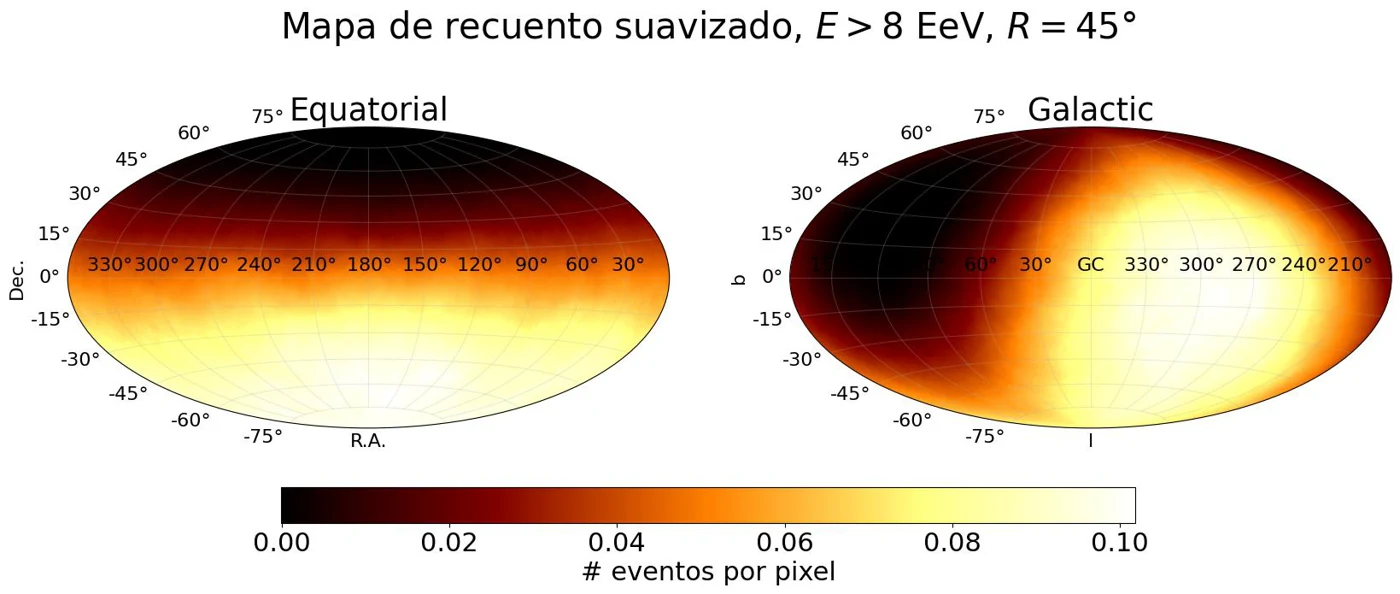
Figure 3 shows the arrival-direction map (number of events per pixel, in Galactic coordinates). The maps are built by dividing the sky into equal-area pixels with the HEALPix scheme (Górski et al., 2005), implemented in the healpy library.
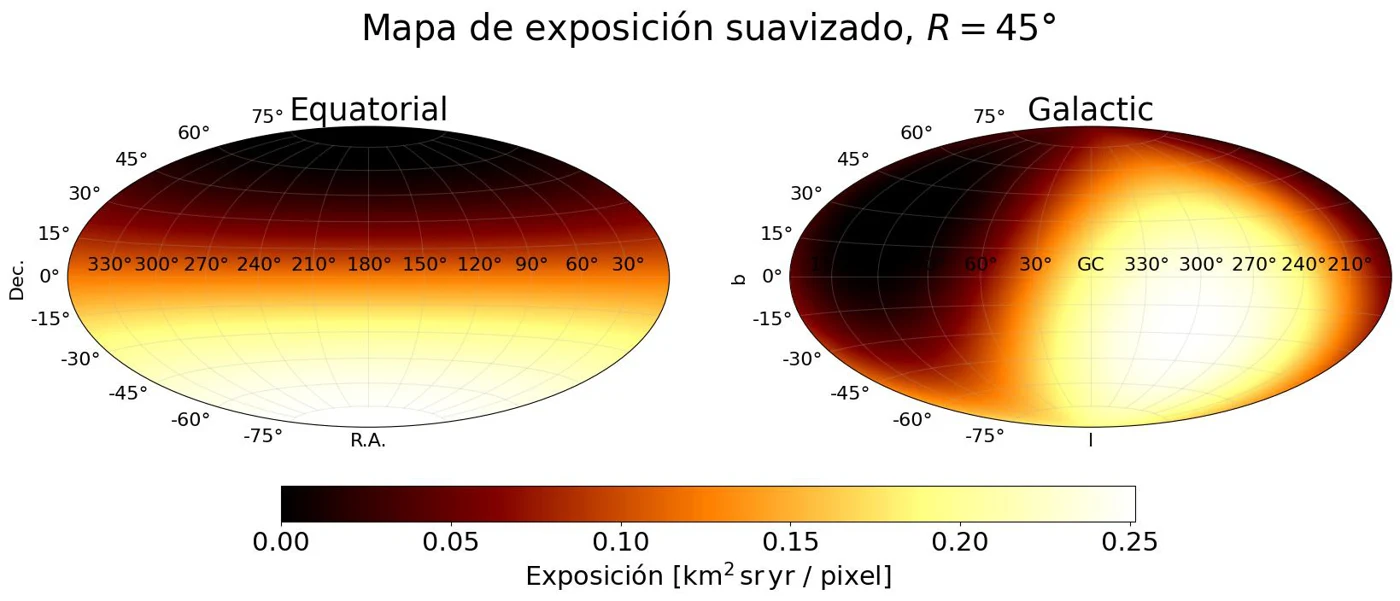
Figure 4 shows the exposure map (how long the detector “looks” at each region of the sky), in both coordinate systems. It is calculated with the analytical expression for the exposure of a surface detector as a function of declination (Sommers, 2001). Since the observatory is in the southern hemisphere, it sees the southern sky better and does not reach very northern declinations; in equatorial coordinates this appears as horizontal bands. The key point is that the exposure is practically uniform in right ascension: as the Earth rotates on its axis, the detector sweeps all right ascensions equally.
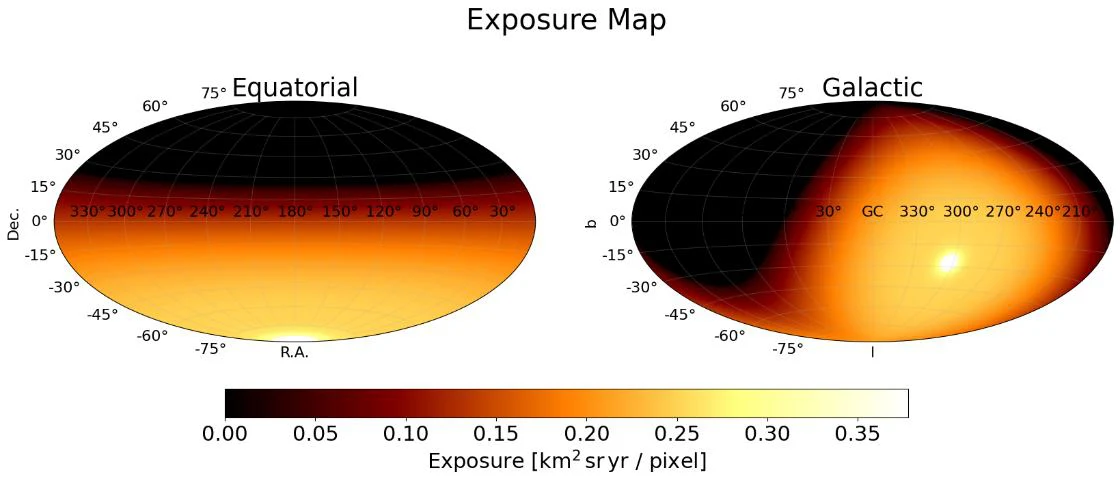
Is this what is expected? Yes. The arrival map reproduces the exposure pattern: there are more events where the detector observes for longer (the south), and not because that part of the sky is intrinsically “richer”. This is the essential difference between the two maps and their different meaning: the exposure map is the reference for what would be seen if the sky were perfectly isotropic, while the arrival map is what is actually observed. At first sight, the arrival map is dominated by the exposure, and any physical anisotropy is masked by the way it is observed; to extract a real signal, the two maps must therefore be compared or, better, right ascension must be analysed, where the exposure is flat. The notebook also includes the arrival map smoothed with a 45° top-hat function (as in the paper), which highlights large-scale structures.
Appendix A includes the smoothed versions of the exposure map and the count map. Their comparison is illustrative: the smoothed count map reproduces the pattern of the smoothed exposure map almost exactly, which confirms that, at first sight, the arrival directions are dominated by the exposure and not by an intrinsic anisotropy. This justifies turning to the Rayleigh analysis in right ascension to extract the real signal.
The Rayleigh analysis
To look for a large-scale anisotropy, a harmonic (Fourier) analysis of the number of events as a function of right ascension α is carried out. This coordinate is used precisely because, as has been seen, the exposure is almost constant in it: any modulation in α signals a real anisotropy, specifically the component of the dipole perpendicular to the Earth’s rotation axis. The Rayleigh analysis consists of fitting the first harmonic of that distribution through two Fourier coefficients:
a = (2/N) Σi=1N cos αi b = (2/N) Σi=1N sin αi
From them, the amplitude r = √(a² + b²) and the phase φ = arctan(b/a) are obtained; the phase indicates the right ascension at which the event rate is highest.
The most valuable feature of the method is that it quantifies the confidence of the result: it gives the probability that, starting from an isotropic sky, chance would produce an amplitude equal to or larger than the one observed:
P = exp(−N r² / 4)
That probability is then translated into a statistical significance (in number of σ). Put simply, the Rayleigh analysis answers three questions at once: is there a preferred direction in right ascension? which is it? and how confident can one be that it is not a coincidence? It is worth noting that the amplitude expected “by chance” decreases as the number of events N increases (the statistical noise goes as 1/√N), so with more statistics the same real amplitude becomes ever more significant.
Results: maximum of the modulation and significance
Applying the Rayleigh analysis to the 2465 events with E > 8 EeV in the subset (Figure 5) gives a first-harmonic amplitude r = 5.8 % ± 2.8 %, a maximum of the modulation at right ascension α₀ = 144° ± 28° and an isotropy probability P = 0.12, equivalent to a significance of 1.5σ. That is, the event rate is highest towards α ≈ 144°, with an amplitude of the order of 6 %.
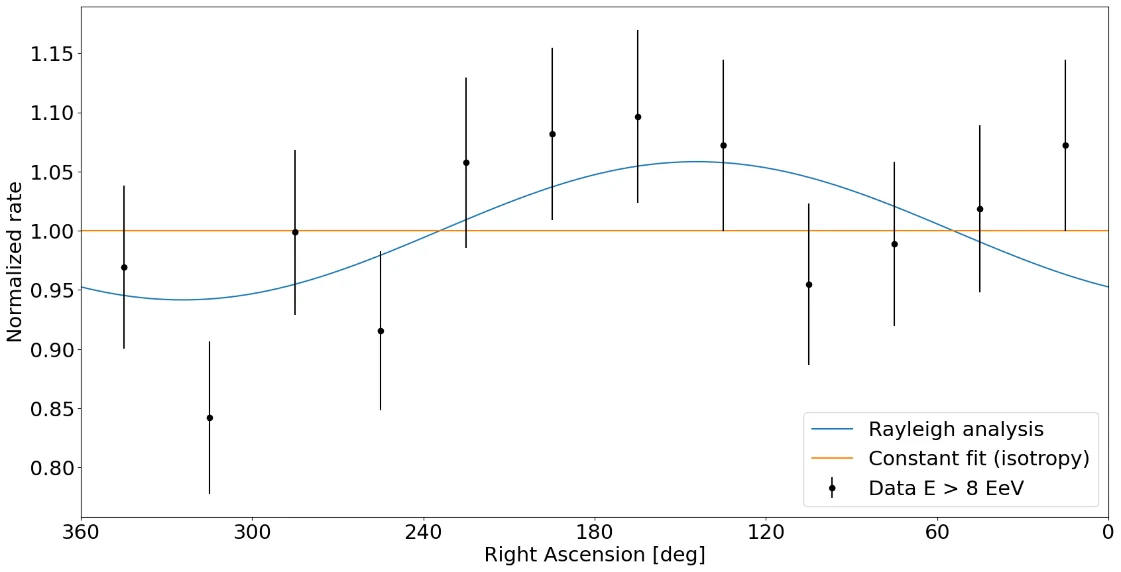
However, a significance of 1.5σ is well below the usual detection threshold (≥ 3σ is usually required to speak of “evidence” and 5σ for a “discovery”). With this data subset, the result is only a hint and remains compatible with the isotropy hypothesis. It cannot be claimed that the anisotropy has been detected; only that the data hint at a modulation in the expected direction.
Comparison with the literature
The paper by Aab et al. (2017), with 32,187 events above 8 EeV, obtains a first-harmonic amplitude r = 4.7 % (+0.8/−0.7), a maximum at α = 100° ± 10° and a significance of 5.2σ (a total dipole of 6.5 % pointing to an extragalactic origin). The comparison with the result of this work is very informative:
- Amplitude: the 5.8 % ± 2.8 % obtained is compatible with the paper’s 4.7 % within the error bars.
- Phase: the 144° ± 28° is about 44° from the paper’s 100° ± 10°, a difference of about 1.5σ: marginally compatible, given the large uncertainty of the subset.
- Significance: here lies the most striking difference, 1.5σ versus 5.2σ. Far from being a contradiction, it is exactly what is to be expected, because the Rayleigh significance grows as √N. With about 13 times fewer events (2465 versus 32,187), scaling the significance obtained, 1.5σ × √(32,187 / 2465) ≈ 5.4σ, approximately recovers the significance reported in the paper. In other words, with the full statistics the same analysis would be expected to reach the level of a discovery.
The results are therefore consistent with, not contradictory to, those of the paper: the same methodology is reproduced and an amplitude and direction compatible within the uncertainties are obtained. Only statistics are missing: a subset of around 8 % of the data is not enough to reach the significance level of a discovery, but it does point in the same direction, that of a dipolar anisotropy of probable extragalactic origin. With more years of data, the Pierre Auger Observatory has strengthened this result: with 19 years of observations, the significance of the dipole above 8 EeV reaches 6.8σ (The Pierre Auger Collaboration, 2025).
Conclusions
The analysis of Aab et al. (2017) has been reproduced on a subset of data from the Pierre Auger Observatory. It has been explained why the SD and FD energy distributions differ (different duty cycle and cross-calibration of two independent estimators), why the angular distributions have different shapes (sin θ · cos θ geometry versus azimuthal symmetry) and why the arrival maps are dominated by the exposure. The Rayleigh analysis in right ascension gives a maximum at α₀ ≈ 144° with an amplitude of the order of 6 % and a significance of 1.5σ: a hint that, within the statistical limitation of the subset, is fully compatible with the 5.2σ dipolar anisotropy of extragalactic origin reported in the paper.
Appendix A. Supplementary material for the map analysis
To complete the map analysis, their versions smoothed with a 45° top-hat function are shown, in equatorial and Galactic coordinates.
References
- Aab, A., et al. (2017). Observation of a large-scale anisotropy in the arrival directions of cosmic rays above 8 × 10¹⁸ eV. Science, 357(6357), 1266–1270.
- Górski, K. M., Hivon, E., Banday, A. J., Wandelt, B. D., Hansen, F. K., Reinecke, M., & Bartelmann, M. (2005). HEALPix: A framework for high-resolution discretization and fast analysis of data distributed on the sphere. The Astrophysical Journal, 622(2), 759–771.
- Sommers, P. (2001). Cosmic ray anisotropy analysis with a full-sky observatory. Astroparticle Physics, 14(4), 271–286.
- The Pierre Auger Collaboration (2015). The Pierre Auger Cosmic Ray Observatory. Nuclear Instruments and Methods in Physics Research Section A, 798, 172–213.
- The Pierre Auger Collaboration (2025). Large-scale anisotropies of ultra-high-energy cosmic rays measured at the Pierre Auger Observatory. arXiv:2507.19243.